Tampilkan postingan dengan label in. Tampilkan semua postingan

Selasa, 24 Mei 2016

Instant Pip Profit - forex market hours gadget

,

Instant Pip Profit ~ forex market hours gadget


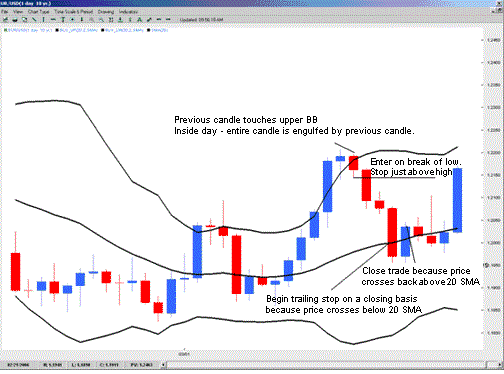
Prices at the upper Bollinger band are considered high and prices at the lower Bollinger band are considered low. However, just because prices have hit the upper Bollinger does not necessarily mean that it is a good time to sell. Therefore, just buying at the lower band and selling at the upper band is out of the question. By definition, price makes new highs in an uptrend and new lows in a downtrend, which means that they will naturally be hitting the bands. With this information in mind, our filter will require that buy signals occur only if the candle following the one that hits the Lower Bollinger band does not make a new low (white candle) and sell signals occur only if the candle following the one that hits the Higher Bollinger band does not make a new high (black candle). This type of candle is commonly known as an inside day. The best time frames to look for the inside days are daily charts, but this strategy can also be used on hourly, weekly and monthly charts. Combining inside days with Bollinger bands increases the likelihood that we are only picking a top or bottom after prices have hit extreme levels. As a rule of thumb, the longer the time frame, the rarer the trade will be, but the signal will also be more significant.
For Buy
1. Look for the currency pair to hit or come very close to hitting the lower Bollinger.
2. Wait for next candle and make sure that the next candles low is greater than or equal to the previous candles low and that the high is also less than or equal to the previous periods high. Basically it should be within the previous candle high and low. Also make sure the candle is while candle. If so, go long at the open of the third candle.
3. The initial stop is placed a few pips below the previous candles low.
4. Trail stop on a closing basis with the 20-period SMA.

For Sell
1. Look for the currency pair to hit or come very close to hitting the upper Bollinger.
2. Wait for next candle and make sure that the next candles high is less than or equal to the previous candles high and that the low is also greater than or equal to the previous periods low. Basically it should be within the previous candle high and low. Also make sure the candle is while candle . If so, go short at the open of the third candle.
3. The initial stop is placed a few pips above the previous candles high.

4. Trail stop on a closing basis with the 20-period SMA.

Instant Pip Profit


Instant Pip Profit reversal Trading with Bollinger Bands


More info for Instant Pip Profit ~ forex market hours gadget:
Read more

Sabtu, 21 Mei 2016

Profit target - forex trading hours malaysia time

,

Profit target ~ forex trading hours malaysia time


The other way to protect open equity profit is to take profits when a predetermined price level or profit threshold has been reached. There are many ways to calculate such profit target thresholds. Profit target orders are set with price or better or price limit orders.
Definition: A profit target is an unconditional exit of a trade with a locked-in profit at some predetermined price or profit level. The incorporation of a profit target into a trading system is a more proactive and aggressive method of profit management. The most positive aspect of a profit target is that once the desired profit is realized, it is captured immediately. It therefore cannot be lost like it can be with a trailing stop. The negative aspect occurs when a profit is taken and the market continues to move well beyond this target level. These potential additional gains are lost because our profit target has closed out the position.
There are trade-offs with the use of profit targets. Some traders cannot live without them just as some cannot live with them. Trading systems that use profit targets, in contrast to those that do not, can be less profitable overall but can produce a higher percentage of winning trades and a smoother equity curve. Sometimes profit targets reduce per trade, and total risk and overall performance can be more stable.
Not all systems are improved by th euse of profit targets.Whether profit targets are beneficial or not very much depends on the style and pace of the trading strategy. In general, active, countertrend trading strategies that trade from overbought and oversold conditions benefit the most from profit target orders. Conversely, slower, trend-following trading strategies generally benefit the least from profit targets.
Profit Target
Profit Target

More info for Profit target ~ forex trading hours malaysia time:
Read more

Legea Cauzalitatii in tehnicile Gann - forex market hours usa

,

Legea Cauzalitatii in tehnicile Gann ~ forex market hours usa


Miscare de acceleratie a pretului absolut superba pe perechea EUR/USD pornita pe nivelul de suport dinamic al unghiului 1x1 aflat in confluenta cu nivelul de rezistenta timp de 33%. Dupa cum putem sa observam in graficul nostru de mai sus pretul si-a finalizat miscarea descendenta pe nivelul de suport dinamic al unghiului 1x1 exact in momentul in care s-a izbit de nivelul de rezistenta timp de 12,50%. Dar de ce a realizat acest bottom major chiar acolo si chiar atunci? Iata o intrebare al carui raspuns este extrem de important. Gann afirma ca in piata ceea ce a mai fost va mai fi. Miscarile de pret respecta anumite patternuri armonice ciclice. Ca sa gasim raspuns la aceasta intrebare ar trebui sa ne intoarcem in timp. Urmariti cu atentie graficul de mai jos.
Dupa cum putem sa vedem pretul a realizat un double bottom. Cand s-a finalizat cel de-al doilea picior al patternului ? In momentul in care pretul se gasea pe nivelul de suport dinamic al unghiului 2x1 aflat in confluenta cu nivelul de rezistenta de 12,5% timp. Revenim la primul grafic si ce observam? Cand s-a format bottom-ul? In momentul in care pretul se gasea pe suportul dinamic al unghiului 1x1 aflat in confluenta cu nivelul de rezistenta de 12,5% timp. Este aici o coincidenta? Vorbim de o simpla intamplare? Personal nu cred in intamplari. Tot ce se petrece in lume se supune legii cauzalitatii. Totul are o cauza ce genereaza un efect. Credinta lui W.D.Gann a fost ca atunci cand invatam sa citim cauzele putem sa predictionam cu exactitate efectele. Tehnica de tranzactionare Gann ne pune la dispozitie o serie de instrumente matematice ce permit determinarea cauzelor si a efectelor lor.
Sunt intrebat de foarte multe ori: Ce va face pretul? Urca? Stagneaza? Coboara? Cand si pana unde va evolua pretul? Raspunsurile la toate aceste intrebari le gasim in grafic. Dar nimeni nu poate sa faca tranzactii corecte cu grafice "aproximative".

Cursul de tranzactionare Gann, pe care il vom incepe saptamana viitoare, ne va invata pas cu pas :
-Scalarea graficelor.
-Setarea instrumentelor de timp si de pret.
-Determinarea vibratiilor Gann
-Constructia corecta a unghiurilor
-Citirea graficelor Gann
-Determinarea nivelelor de intrare intr-o tranzactie
-Stabilirea nivelelor de stop loss
-Calcularea raportului Risc-Profit
-Filtrarea tranzactiilor
-Managerizarea tranzactiilor
-Iesirea dintr-o tranzactie
Cursul se va desfasura prin email si dureaza  11 zile.
Pe parcursul cursului toate tehnicile vor fi ilustrate cu exemple practice, pas cu pas, din piata Forex curenta.
Cursul se sustine in limba romana. Studentii din strainatate pot sa-l traduca cu ajutorul google translate. Cursul este insotit de foarte multe exemple grafice, practice. In cazul in care studentii din strainatate vor avea neclaritati datorate traducerii automate cu google translate vor putea sa puna intrebari concrete si vor primi raspunsurile in limba engleza.

Inscrierile la curs se fac la adresa de email gannmasterforex@gmail.com
Plata se face prin paypal.
Fiecare student incepe cursul imediat dupa confirmarea platii si finalizeaza dupa 11 zile.
Pe tot parcursul cursului studentii pot sa puna intrebari asupra tematicilor abordate. 


More info for Legea Cauzalitatii in tehnicile Gann ~ forex market hours usa:
Read more

Kamis, 19 Mei 2016

Candle in channel - questrade forex trading hours

,

Candle in channel ~ questrade forex trading hours


Candle in channe,l this system is incredibly easy, but trades don’t occur too often.
Using this system on the 4-hour and Daily charts is advised.
The system uses:
6ema (of price highs)
6ema (of price lows)
50ema (of price closes)
We BUY when price is ABOVE the 50ema, a candle forms INSIDE the

6ema-channel, and price breaks the HIGH of this small candle:
Candle in channel
We SELL when price is BELOW the 50ema, a candle forms INSIDE the
6ema-channel, and price breaks the LOW of this small candle:
Candle in channel
Candle in channel
Exit position
Daily time frame
Set the stop loss level 30 pips below/above the entry the price, or below/above the previous low/high. Move the stop to the entry price (breakeven) at 35 pips profit.
Exit the trade at a profit of 50 pips or more.
4h time frame
Set the stop loss level 25 pips below/above the entry the price, or below/above the previous low/high. Move the stop to the entry price (breakeven) at 20 pips profit.
Exit the trade at a profit of 30 pips or more.

More info for Candle in channel ~ questrade forex trading hours:
Read more

Selasa, 17 Mei 2016

The Straddle trade step by step - forex trading hours in ist

,

The Straddle trade step by step ~ forex trading hours in ist


The straddle trade step by step
1. We identify a day in which a major news announcement is expected – –one which is likely to move a specific currency.
2. We identify the time of the expected news release.
3. We observe the market activity as the date and time approach.
(We are looking for indications that the market is anticipating a serious move.
This would be indicated by the prices moving within a tight range for at least
5 – – 6 hours prior to the expected news release.)
4. We take note of the upper and lower bands of the range and establish resistance and support price levels.
The Straddle trade step by step
5. We enter buy and sell orders 15 – – 20 is PIPs away, on either side of the resistance and support levels, thereby “ “ straddling” ” the market.
6. We enter stop loss orders for each of our opening orders to ensure proper equity management. Stop Loss orders should be no more than 5% of your equity on a trade, i.e. 25 PIPs.
The Straddle trade step by step
7. We wait for the news release to move the market to our order price.
Once the market trades at our price, our order will be filled.
8. We now have to cancel the opening and stop loss orders that are no longer relevant and monitorour active trade.
The Straddle trade step by step
9. We may now begin to move our stop loss order on the active trade in order to lock in profits (“ “ trail our stop” ”) – – though not too closely lest the market take us out on a t retracement wave.
10. When we reach our limit order, predetermined profit level or we notice the trend has broken, its time to take profits and close the trade. Remember to cancel the open stop loss order if it doesn’ ’t
automatically cancel.
The Straddle trade step by step


More info for The Straddle trade step by step ~ forex trading hours in ist:
Read more

Sabtu, 14 Mei 2016

Forex Trading Strategy 88 - forex trading urdu book download

,

Forex Trading Strategy 88 ~ forex trading urdu book download


Trade of the Week: EUR/USD H1: 26 - 27 February: +2.5% Profit (+120 pips)


For more details, click "Examples of Trade" in the menu

We knew D1 was  downtrend, on H4 we have a nice sleeping alligator, on H1 same, we have a sleeping alligator & the Ewave is about to cross the zero line (always a strong signal), we take the H4 break and the price drops before the news. The news are poor for the USD but the price keeps falling and we exit the next morning when price breaks the opposite side of the fractal box for +120 pips (+2.5%)


More info for Forex Trading Strategy 88 ~ forex trading urdu book download:
Read more

Breakout entry Pullback entry swing setup examples - forex trading hours good friday

,

Breakout entry Pullback entry swing setup examples ~ forex trading hours good friday


Breakout and pullback conditions for setups.
Before a stock or currency pair makes our breakout “watchlist,” it must satisfy two key criteria:
Stock or currency pair must be in uptrend
Stock or currency pair must have a valid basing configuration pattern.

How define an up trend (for down trend reverse conditions).

20?day EMA must be trading at or near the 50?day MA when the stock is forming a base and clearly above the 50?day MA when in trend mode.  For pullback trades, the 20?day EMA must be above the 50?day MA.
-20?day EMA must be above the 200?day MA
- 50?day MA must be above the 200?day MA
-Both the 50 and 200?day MAs must be in a clear uptrend for at least a
few months. 
- The price action should be in an uptrend with a series of higher highs
and higher lows in place over the past 3 ? 6 months (at the very least).
- Current price should at least be 30 ? 40% above the 52?week low

Trend qualifier – rules for breakout setups in the picures the examples.
rules for breakout setups

rules for breakout setups

rules for breakout setups
Valid basing pattern for breakout entry

- A base (or zone of congestion) is anywhere from 1 month to 1 year in length. For our style of trading, we prefer bases that form in a 1 - 3 month period that find and hold support of the 50-day
MA.
-We want to see “tight” price action in the base, especially during the last two weeks before the breakout.
-A valid base should pullback anywhere from 10 - 30% off the swing high. Once a stock retraces 40 - 50% or more, we begin to question the strength of the uptrend.
We must see a “higher low” form within the base. This is crucial to the pattern. Without a higher low forming, we have no way to set a stop and therefore can not define the risk.
- Volume should be declining during a base, or at the very least, not heavier than average. If there are too many days of heavy volume selling in a base, the base could be faulty.
Main characteristics of a valid base

Main characteristics of a valid base
The Breakout Entry examples.
    Breakout Entry the trigger
Breakout Entry the trigger

Breakout Entry
Breakout Entry

A pullback setup occurs when a stock breaks out from a valid basing pattern and then pulls back for 3 – 7 days:
Pullback setup
Pullback setup

Pullback Setup

Pullback setup step by step
Reference Deron Wagner

More info for Breakout entry Pullback entry swing setup examples ~ forex trading hours good friday:
Read more

Jumat, 06 Mei 2016

Breakout Traders - forex trading hours in uk

,

Breakout Traders ~ forex trading hours in uk


Breakout traders tend to focus on trendiness combined with trading channels, and attempt to profit from a currency that breaks above resistance or below support. Such traders are assuming a break of
technical barriers will lead to a continuation of the move. Breakout traders are similar to trend traders in that they require the market to move in the intended direction before they are willing to enter. Accordingly, this strategy comes with the same difficulties faced by trend traders; buying
at high prices and selling at low prices. nonetheless, should the market actually continue to move following the technical breach of support or resistance, the gains could be significant. Like trend trading, this approach to trading offers traders relatively low odds of success for each given trade, but the hope is to catch a big enough winner to return a profit despite numerous losses beforehand.
“I believe the very best money is made at the market turns. Everyone says you get killed trying to

pick tops and bottoms and you make all your money by playing the trend in the middle. Well, for twelve years I have been missing the meat in the middle but I have made a lot of money at tops and bottoms.”—Paul Tudor Jones
Breakout traders
Breakout traders


More info for Breakout Traders ~ forex trading hours in uk:
Read more

Kamis, 05 Mei 2016

3 12 Tunnel Breakout - forex market hours in pakistan

,

3 12 Tunnel Breakout ~ forex market hours in pakistan


3/12 Tunnel Breakout is a simple breakout system trend following requires:
three exponential moving averages:
12ema (of price highs);
12ema (of price lows);
3ema (of price closes).
Top Tip: This system is great for the Daily timeframe to get on board
some big runs... the 4-hour timeframe works well too!
Currency pairs: EUR/USD, USD/JPY, GBP/USD,USD/CHF, AUD/JPY, EUR/JPY, GPB/JPY, AUD/USD, NZD/AUD NZD/USD, USD/CAD, EUR/CAD, GBP/CAD, GBP/AUD, GBP/NZD..
To trade this system we just wait until the 3ema has gone in between the
high and low lines of the 12ema-channel.
On the next candle that closes and causes the 3ema to rise above the
12ema-channel – BUY:
3/12 Tunnel breakout
On the next candle that closes and causes the 3ema to fall below the
12ema-channel – SELL:
3/12 Tunnel Breakout
Exit position is discetionary but see this examples:
4H time frame
stop loss 30 pips on GBP/USD and 25 pips on EUR/USD;
profit Target 40 pips GBP/USD 30 pips EUR/USD.
daily time frame stop loss 60 pips on GBP/USD and 50 pips on EUR /USD;
profit Target 80 pips GBP/USD 60 pips EUR/USD.
Note this trading system is created only for higher time frame. Best time frame is 8H, 12H , or daily.


More info for 3 12 Tunnel Breakout ~ forex market hours in pakistan:
Read more

Sabtu, 30 April 2016

Forex Trading Strategy 90 - forex trading uk tax

,

Forex Trading Strategy 90 ~ forex trading uk tax


Market Analysis of the 23rd of February 2014 : Opportunities on EUR/USD, GBP/USD, USD/JPY, USD/CHF, AUD/USD, XAU/USD, EUR/JPY, USD/CAD & NZD/USD D1, H4 & H1

Click on the Menu on "Market Analysis" for all the analysis.

Daily charts: For most of the pairs, we are in the wave 4 and/or there is no clear direction. Prudence

EUR/USD: We are in still in the wave 3 down, some pullback but no divergence. Downtrend
GBP/USD: We are in the wave 4 (probably the "a" move up). Prudence.
USD/JPY: We are in the wave 4, we expect the wave 5 to come (this is a D1 setup). Prudence if price is inside the box
USD/CHF:  We are in the wave 4; Prudence
AUD/USD: We are still in the wave 5 down and still downtrend but the Ewave comes back to the ZL. Prudence
EUR/JPY: It looks like we are in the wave 4 (not officially). Prudence
USD/CAD: We are still in the wave 3 up, some pullback but no divergence. Uptrend
NZD/USD: We dont have trend anymore, it looks like a 5 wave cycle has been completed, we need to wait as well
XAU/USD: We are now in the wave 3 down, The overall trend remains unclear.

For orientation/direction of trades, click  "Signals" in the menu (from Monday 23rd 8:00 GMT+1)


More info for Forex Trading Strategy 90 ~ forex trading uk tax:
Read more

Sabtu, 23 April 2016

Fibonacci basic tutorial - forex market hours gadget windows

,

Fibonacci basic tutorial ~ forex market hours gadget windows


My experience makes me a believer in the adage that there is a natural order in the markets that has more geometric symmetry than most traders realize or want to believe. This is a fact, not subjective, because almost all market turning points adhere to a certain numerical sequence that you can prove to yourself by looking at historical charts. This sequence applies to both price and time. The primary tool used for this trade analysis is Fibonacci relationships. They include Fibonacci retracements and extensions, as well as time measurement, pivot dates by ratio and numerical sequence.
There is no need to go into the history of Fibonacci, other than to know it is the force that rules the movement of about anything you can imagine, including the financial markets.
The Fibonacci series is a numerical sequence that expands by adding the previous numbers together as shown here:
1, 1, 2, 3, 5, 8, 13, 21, 34, 55, 89, 144, 233, 377, 610, 987, 1597, 2584, 4181, etc.
Fibonacci
The most interesting property of this numerical sequence is that as the series proceeds, any number is 1.618 times the preceding number, and 0.618 of the next number.
Example:
1.618 x 34 = 55 x 1.618 = 89 x 1.618 = 144.
.618 x 55 = 34, .618 x 89 = 55, .618 x 144 = 89.
The .618 and 1.618 numbers are what they call the Golden Numbers. You will also see the sequence root of .618, which is .786, and 1.272, the square root of 1.618, occur frequently in your trading.
Suffice to say, the Golden Numbers are dominant in math, nature and science. Planets revolve around the Golden Number, as does your heartbeat on an EKG, and even the index finger on your hand. Each section of your index finger, from the tip to the base of the wrist, is larger than the preceding one by about the Fibonacci ratio of 1.618. And lastly, they tell us that the Egyptian pyramids are based on the Golden Ratio/Numbers.
Key Point:  My source for all of this trivia is goldennumber.net, but you can just go to Google.com and find any number of sites that give you this background in volume. If you believe it, I can teach you how to use it in a pragmatic way trading and investing in the markets.
Key Point:  In spite of all the financial, economic and geopolitical events that affect the markets, you will see beyond any doubt that the up and down price fluctuations in all major markets are governed by the Fibonacci Golden Ratio.
Fibonacci is a sequence tool that is excellent by itself and that becomes very powerful when combined with volatility bands and standard deviation, let alone any of the other tools.
Fibonacci Retracement
I use the following Fib retracement ratios:
  • .236
  • .382
  • .50
  • .618
  • .786
  • 1.00
The minor ratio that will come into play sometimes is the .707 Fib retracement (square root of .50).

Retracements depict the potential reversal levels, support and resistance.
To calculate a retracement in an uptrend, which is when a stock rallies and then pulls back to some percentage ratio of the previous swing point low, you would do the following:
  • High - Low x Fib Ratio, then subtract it from the High.


  • Calculation of .618RT level    

        60 - 40 = 20 x .618RT = 12.36
        60 - 12.36 = 47.64 (.618RT level)
  • Complete the other ratios for practice.
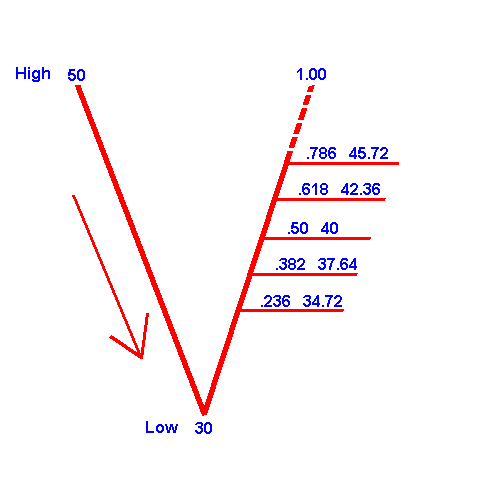
  • To calculate a retracement in a downtrend, which is when a stock declines and then pulls back to some percentage ratio of the previous swing point high, you would do the following:
    • High - Low x Fib Ratio, then add it to the Low.
    • Calculation of .382 level

          50 - 30 = 20 x .382 = 7.64
          30 + 7.64 = 37.64 (.382RT level)
       
      mplete other ratios for practice
    • fibonacci retracement

    • Fibonacci Extensions
      I use the following Fib extensions ratios:
      • 1.272
      • 1.618
      • 2.00
      • 2.24
      • 2.618
      • 3.14 (Pi -- Key ratio)
      • 4.236 
      These extensions occur after price exceeds the 1.00 level and makes new lows or new highs beyond the last leg.
      A minor extensions ratio that will come into play sometimes is the 1.414.
      To calculate a Fib extension after price exceeds the low or high of the last leg, you would:
      Extension down
      • High - Low x Ratio, then subtract from the High.
      Calculation of 1.272 extension down

          90 - 80 = 10 x 1.272 = 12.72
          90 - 12.72 = 77.28
       Extension Up
      • High - Low x Ratio, then add to Low.
      • Calculation of 1.618 extension up

            90 - 80 = 10 x 1.618 = 16.18
            80 + 16.18 = 96.18

         
      • We have given you some Fibonacci background, and the basics of calculating the retracements and extensions, in addition to the ratios that I suggest you use. Now we will build on that.
        Key Point:  When you look at retracements and extensions in terms of price, you should also look for symmetry of time using the same ratios. It is not mandatory that you have both, but it is much better symmetry when you do, which builds your case for higher probability.
        Key Point:  Once you have identified a high-probability zone, it is the price action at that zone that determines what you will do.
        The following SPX charts will demonstrate retracement, extension, time and price action at different zones.
        Fibonacci tutorial
        Fibonacci Tutorial 
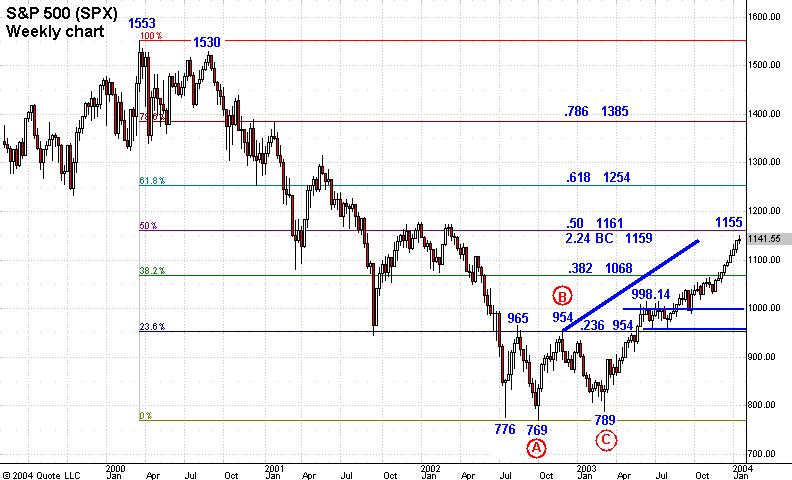
    • This SPX weekly chart frames the Fibonacci retracement levels between the 1553 top and 769 bottom. You can see that the .236RT to 1553 of 954 was a major obstacle. The first rally from 776 reached 965, but didnt close above it.
      From 965, the SPX declined to the 769 bottom (A) and then rallied to 954, right at the .236RT level, but failed to close above 954. The next leg down (BC) made a 789 low, then reversed to the upside and approached the .236RT level for the third time.
      Key Point:  The more price trades at resistance or support, the weaker the line is and the probability of penetration increases.
      Price breaks above 954 and trades to the 1015 level. The 1.272 Fib extension of the BC leg is 999, and for 12 weeks, the SPX traded sideways with a high close of 998.
      Key Point:  If price breaks out of a range at a Fib level, the highest probability is that it will seek the next level.
    • The .382RT to 1553 is 1068, and that is exactly where the SPX traded and went sideways for four weeks (more detail on next chart) before breaking out and trading to the next Fib zone, which is the .50RT to 1553 of 1161. Notice also that there is a confluence with the 2.24 Fib extension of the BC leg at 1159. At the completion of this course on Jan. 29, 2004, 1155 is the rally high on Jan. 27, the SPX had traded down to 1122.38.
      This chart demonstrates the natural order that the SPX has traded just using Fib retracements, extensions and time, which you will see better on the next chart. You have anticipated the key zones in advance.
    • On this chart, we will start with the time symmetry that is present in this move.
    • The BC leg from 954 - 789 was 14 weeks to the low and 13 weeks (Fib number) to the low close. Any reversal bar setup right there had to be taken. The 789 low week was a reversal bar (Hammer) with a high of 841.39. Sequence traders took entry.
      Now it gets more interesting. Once price broke out above 954, you had anticipated the 1.272 zone, but on this chart, you also see that the last low in that zone was week 21 following the 789 low week. 21 is the 1.618 Fib extension of 13. Price then rallied, breaking out of the 1.272 zone range.
      Key Point:  When looking for time symmetry, you can use the low close or low, and measure it with a high close or high. That will all be considered symmetry.
    • After the 1.272 breakout, the SPX traded right up to the .382RT zone at 1088. The first weekly bar in that range was the 34th week, and price went sideways for four to five weeks with a high of 1064. Once again, there was price and time symmetry, as 34 (Fib number) is the 2.618 Fib extension of 13.
      The advance above the .782RT level means anticipation of the next Fib RT zone, which would be the .50RT to 1553 at 1160. There is also a .50RT to the 1530 secondary high of 1150, and then the 2.24 Fib extension of the BC leg at 1159. The 1530 high was the 1,2,3 lower top to the 1553 all-time high after the initial decline to below 1350 from 1553. That would make it a significant high to measure a retracement.
      From a time perspective, the 1155 high is Week 46 and the high close is Week 45. The 3.14 Fib extension of 14 is 44.
      Review these two charts several times so you gain a good idea of the structured way a market trades most of the time and enables you to anticipate high-probability zones where you will take some kind of action, either buy or sell, but it is never nothing.

More info for Fibonacci basic tutorial ~ forex market hours gadget windows:
Read more

Kamis, 21 April 2016

S 1 million gone in one year - forex trading zar

,

S 1 million gone in one year ~ forex trading zar


It is situation like this that causes people to shun away from giving generously to charity or not giving at all. Makes one wonder whats the point when the beneficiaries spend the money like nobodys business. 

But then again, is it really their fault? 
I believe it all boils down their inability to cope this huge amount of money suddenly. 
So, is money the root of all evil?

"You can only manage what you can measure." 

Wise words from a seminar i had previously attended.
Yes indeed, we can only handle what we know we can handle, anything more would just fall off every time, no matter how many times.

It is therefore very important to set our own threshold and habit for handling money.
Here is a list of money management ideas to share;

1) 52 Week Money Challenge

2) Open a high interest savings account

3) 6 Jars to financial freedom

Once you have decided on a suitable plan, stick to it.
The general rule is "Its not the amount that matters, but the habit."
More info for S 1 million gone in one year ~ forex trading zar:
Read more

Indicele dolarului evolueaza in continuare in structura corectiva - xm forex trading hours

,

Indicele dolarului evolueaza in continuare in structura corectiva ~ xm forex trading hours


La finalul saptamanii precedente indexul dolarului american s-a depreciat pana pe zona de suport fix de 75% a box-ului nostru Gann, de 90 de zile. Putem sa observam cu usurinta din graficul de mai sus ca in acest moment pretul evolueaza in cadryl unei structuri corective sub unghiul 1x1. Consideram ca in aceasta saptamana , exista o buna probabilitate ca pretul sa se resinga de pe aceasta zona si sa intre intr-o miscare de raliu de retestare a unghiului 1x1. Cu toate acestea nu vom deschide o pozitie long pe indicele dolarului. Din punctul nostru de vedere indicele dolarului se gaseste intr-o structura corectiva negativa ce ar putea trimite pretul spre 96.50. Vom astepta finalizarea acestui raliu ,cel mai probabil in zona lui 99.50/100, pentru o posibila pozitie short cu un prim target la 98.45 si un al doilea target la 96.50.


Înscrieri la Cursurile de Analiz? Gann ?i abonare la Buletinul de Analiz? S?pt?mânal? Gann pe email
gannmasterforex@gmail.com  si pe Patreon.com

Daca analizele noastre va plac distribuiti link-ul prietenilor dumneavoastra pe canalele de socializare. Doriti sa aflati mai multe despre analiza Gann, puneti intrebari in rubrica noastra de comantarii. Va vom raspunde pe blog sau in privat dupa cum doriti.  

More info for Indicele dolarului evolueaza in continuare in structura corectiva ~ xm forex trading hours:
Read more

Minggu, 17 April 2016

5 min Bollinger Bands Intraday System - forex trading times gmt

,

5 min Bollinger Bands Intraday System ~ forex trading times gmt


On a chart of 5-minute bars for a stock, plot out the 10-bar moving average and the Bollinger bands for 2 standard deviations on either side of the average. Then apply the following system:
Buy when the stock falls 3 percent below its lower band. Hold until at least the end of the 5-minute bar where the stock was bought.
Sell when the stock hits a 1 percent profit target or at the end of the second bar after the stock was bought.
The critical issue is how to keep track of all the stocks one is interested in. Before the open, use charting software such as eSignal or TradeStation, or Wealth-Lab (which is the software I use for all of my testing) to identify the Bollinger band levels for each stock. It is then possible with all of these packages to set up alerts and even interface with direct-access brokers, such as Interactive Brokers or Cybertrader, to actually make the trades automatically.
The key in all of these examples is time. Basically, the market has such an
extreme and quick selloff in order to trigger this system that the stock ei-
ther bounces back immediately or flounders about. If the latter, then we
promptly get out since we are only looking for our profit target within the
ten minutes following the entry bar.
ORCL, 5/20/2002, 10:30 AM

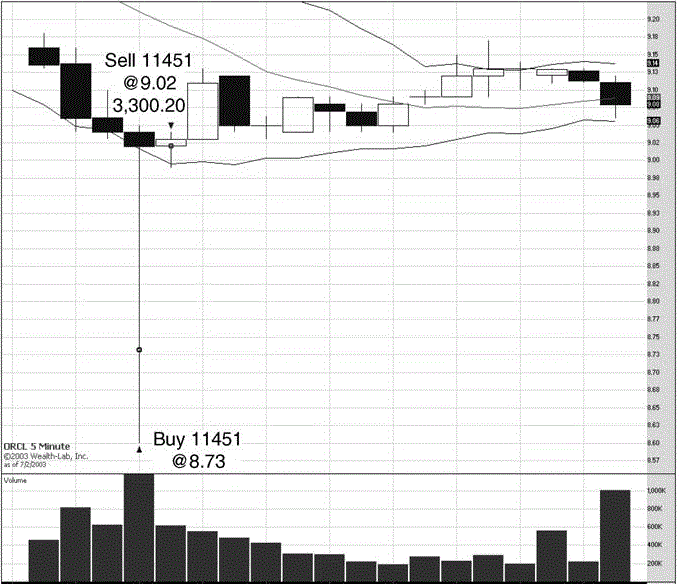
Merrill Lynch, in a post-Blodget fury of tech pessimism, reiterated a broads weeping recommendation the morning of May 20, 2002, to sell technology stocks into any strength. While their prediction proved mildly prophetic for all of two months, anybody short technology at May 2002 levels would have been killed over the following year. Nevertheless, the panic to get out of the popular tech issues, for instance ORCL, was enough to trigger a signal on ORCL at 10:30 AM at 8.73 (1). In a brief flurry of selling, it hit 3 percent below its lower band, which it had been steadily walking down all morning. Buying at the critical level and holding until the open of the next 5-minute bar would have resulted in a quick 3.3 percent profit with the sale at 9.02.
5 min Bollinger Bands System
MSFT, 4/3/2000
Many of examples occur close to the open of the day, which is the time when there is the most volatility and also the most panic. The market has had all night to hear and absorb news, and thus the open is when the most participants at once are acting on that news.
Look at Figure 2. On April 3, 2000, MSFT gapped down and triggered signals for two five-minute bars in a row, at 9:30 AM at the open and 5 minutes later at 9:40 AM . The first signal was sold off at the close of the second bar at 47.69 for a 1 percent profit, and the second signal, which was bought at the open of the second bar at 47.44, was promptly sold at 47.91 for a 1 percent profit.
5 min Bollinger Bands Intraday System
AMAT, 11/12/01
On the morning of November 12, 2001, a plane crashed near Kennedy air port. The crash was not apparently an act of terrorism but nobody knew that at the time. Futures spiked lower and the tech stocks, which were hit hardest during the week after September 11, 2001, suffered a minicrash im-
mediately prior to the open. Being alert and capitalizing on the panic would have enabled one to buy AMAT, which triggered a buy signal at its premarket low at 18.20 when it hit 3 percent lower than its lower Bollinger band (Figure3, . Holding to the close of that 5-minute bar would have enabled one to sell immediately at 19.33 for a 6.15 percent profit.
5 min Bollinger Bands Intraday System
 
5 Min BB System, 2/2/02–6/30/03 results
 

You can apply this system also at the Forex Majors (with 20-30 pips outside the bands).


More info for 5 min Bollinger Bands Intraday System ~ forex trading times gmt:
Read more

Rabu, 13 April 2016

Dolarul australian gata de short in fata francului elvetian - forex trading platforms in india

,

Dolarul australian gata de short in fata francului elvetian ~ forex trading platforms in india


Dolarul australian versus francul elvetian a realizat o miscare descendenta finalizata pe suportul fix de la 0,666 a boxului nostru Gann de 90 de bare, de pe graficul de o ora. Dupa finalizarea miscarii descendente  pretul a intrat in raliu realizand o structura corectiva ce s-a finalizat exact in momentul in care pretul s-a suprapus cu nivelul de rezistenta timp de 50%. Acela a fost momentul cand pretul a incput sa se deprecieze si in acest moment dupa ce a spart canalul de consolidare testeaza zona suportului dinamic al unghiului 1x1. Daca suportul dinamic va ceda exista un foarte bun potential ca dolarul australian sa se deprecieze fata de francul elvetian si sa caute suportul unghiului 8x1.

Înscrieri la Cursurile de Analiz? Gann ?i abonare la Buletinul de Analiz? S?pt?mânal? Gann pe email
gannmasterforex@gmail.com  si pe Patreon.com

Daca analizele noastre va plac distribuiti link-ul prietenilor dumneavoastra pe canalele de socializare. Doriti sa aflati mai multe despre analiza Gann, puneti intrebari in rubrica noastra de comantarii. Va vom raspunde pe blog sau in privat dupa cum doriti.  

More info for Dolarul australian gata de short in fata francului elvetian ~ forex trading platforms in india:
Read more

Senin, 11 April 2016

Principal components of a trading system - forex market hours malaysia

,

Principal components of a trading system ~ forex market hours malaysia


All trading system have three major components:
1. Entry and exit (filter optional).
2. Risk management.
3. Position sizing.
Trading strategy overview
Entries and exits are the engine or driver of trading in a strategy. They can be very simple or extremely complex. They can be filtered by one or many different elements. An entry can be at a specific price level or at the market or on the open or close. A trading strategy can employ more than one entry or exit. It can use one method to enter a trade and an entirely unrelated method to exit. The variety of entries and exits is really without bounds. A strategy typically consists of buy-and-sell conditions that mirror, or are the opposite of, each other. For example, a buy signal occurs when price rises through a three-day high and a sell signal occurs when price breaks through a three-day low. This is an example of what is called a symmetrical trading strategy.
A strategy can also consist of completely different buy-and-sell entry conditions. For example, abuysignal occurswhenafive-day high is broken and asell signal occurs whenafive day moving average falls below a 20-day moving average. This is an example of an asymmetrical trading strategy.
A trading strategy may include risk management in the form of a stoploss order. Risk management is a way to limit the amount of capital at risk during the life of a trade. A typical risk management approach is to set a stop-loss order that is the maximum, yet subject to slippage, loss to be taken on a trade. For example, assume that a long position is initiated at a price of 1,495.00 in S&P futures. The strategy calls for a maximum risk of $1,000 or 4.00 points. Therefore, after the position is entered, a protective sell stop is also entered. If our risk is $1,000, or 4.00 points, then our sell
stop will be 1,491.00 (1,495.00 – 4.00).
A trading strategycan also include profit management. This is a method of protecting the open equity profit that must develop during the life of a winning (and sometime losing) trade. A typical profit management approach for a long position is to set a trailing stop at a fixed dollar amount
below an equity high, that is, the highest price achieved during the trade.
Assume a strategy that calls for a trailing stop of $2,000, or 8.00 S&P points. This point value will trail under progressively higher prices during our long position. Assume that the long position is entered at a price of 1,390.00 and an equity high point of 1,410.00 is reached on the fourth day of the position. A sell stop is entered at 1,402.00 (1,410.00 – 8.00 points). This locks in
a $3,000 profit, subject to slippage (1,402.00 – 1,390.00).
Another type of profit management is the target order. This is a more proactive or aggressive way of capturing trading profits. A typical approach to the target order is to place a price order at a price above or below the position price. Assume a strategy that employs a $2,000, or 8.00 points,
profit target. A long S&P position is taken at 1,375.00. A price order is then entered to sell at 1,383.00 (1,375.00 + 8.00 points). If the market rallies to this price, our sell order will capture a profit of $2,000.
Trading system as entry and exit
A trade is composed
of at least one buy and one sell. A trade begins by entering, that is, taking a position in, the market either by going long (buy) or going short (sell) and ends with an equal and opposite offsetting or liquidating trade that closes the trade out. For example, a long trade starts when the trader buys ten
contracts of S&P index futures and ends when he sells ten contracts of the same future. A short trade takes the opposite course.
A trading strategy with a positive expectancy enters the market on a condition(s) that has proven itself capable of identifying an opportunity to make a trading profit. Such a trading strategy will exit the market when there is nothing left to be gained in the current trade.
theperfect entryisonethatalwaysoccurs
atthebest price(thelowestbuyandhighestsell)andproducesaprofit.The perfect exit extracts the last dollar of profit from a trade. Of course, any trader knows this is a perfect ideal and impossible to attain in practice. It is valuable, however, to hold this concept in mind as a guiding principle when designing a trading strategy. Let us now get into some details, definitions, and examples.
Definition: An entry rule initiates a new long or short position. An entry can occur only when the system has no current position, or is flat. Some examples of buy, or long, entry rules (sell, or short, entry rules are the opposite) are:
A 5-day moving average crosses from below to above a 20-day moving
average;
The Relative Strength Index closes below a reading of 20;
The daily close rises by 1 percent and the weekly close rises by 1 percent;
Today’s close is higher than yesterday’s close plus 50 percent of the daily range;
Today’s close is higher than the previous three closes
Definition: An exit rule closes out a current long or short position. An exit can occur only when a strategy has an open long or short po-sition. A symmetrical trading strategy exits its trades on an opposite entry signal. An example of an exit from a symmetrical moving average trading
strategy that uses opposite entries is:
Close out, or exit from, a long position when the 5-day moving average crosses from above to below the 20-day moving average. A trading strategy can be reversing or non reversing.
Definition: A reversal rule closes out a position and initiates a new and opposite position.
Of course, a reversal can occur only when there is a position. A reversal is an exit of the current position and the entry into a new and opposite position. The current position is exited and enters a new and opposite position. An example of a reversal rule is to close out the current long position
and go short when the 5-day moving average crosses from above to below
the 20-day moving average.
A trading strategy that reverses position on every new entry will, of course, always have a position in the market. Of course, a trading system can have rules that make it reverse only under specific conditions. Under other conditions, it will use the new signal to exit the position.

A trading strategycan also be non reversing. In other words, it uses an opposite entry, or some other rule, to exit the position. Such a strategy will then wait for some other rule signal to initiate a new position. A non reversing rule is simply an entry or some other rule used as an exit rule as defined earlier.
trading system
trading system

More info for Principal components of a trading system ~ forex market hours malaysia:
Read more

Making Money in Forex Trading - forex trading software comparison

,

Making Money in Forex Trading ~ forex trading software comparison


Making Money in Forex Trading


The Forex market has a daily volume of over $4 trillion per day, dwarfing the volume of the equity and futures markets combined. Thousands of people, all over the world, are trading Forex and making tons of money. Why not you?
All you need to start trading Forex is a computer and an Internet connection. You can do it from the comfort of your home, in your spare time without leaving your day job. And you dont need a large sum of money to start, you can trade initially with a minimal sum, or better off, you can start practicing with a demo account without the need to deposit any money.
Once you consider to start Forex trading, one of the first things you need to do is choose a broker, choosing a reliable broker is the single most critical factor to Forex success.
There are dozens of online brokers out there but your best bet is to go with the leader.
Based on our experience, The best online FX broker for beginners and pros alike is e-Toro (If the link doesnt work, copy and paste the following URL into a browser: www.liraz.com/etoro). Why? for starters this broker is rated among the best in trading quality, security, bonuses, payout and experience. More than that, e-Toro is much more than a simple Forex broker, it is a "social network" that allows you to copy the trading strategies of the network’s best traders (according to the company, over 85% of copied trades on e-Toro are profitable). You have to see it to believe it. Unfortunately, this broker does not accepts US residents.
Now I would strongly encourage you to go and visit the above brokers site right now even if you are not yet decided whether you want to go into Forex trading. Why? because it provides tons of free education materials, videos and best of all a demo account that allows you to practice Forex trading for free without the need to deposit any money. Simply go to the site, register for a free account and start "trading" - by actually practicing and experiencing it firsthand youll be able to decide whether Forex trading is for you.
In any case, before starting to trade for real, it is advisable that you practice with a demo account. Once you build some skill and feel more comfortable with the system you  can start trading gradually for real money.


More info for Making Money in Forex Trading ~ forex trading software comparison:
Read more

Jumat, 08 April 2016

EUR USD evolueaza in interiorul unei structuri de consolidare - forex trading software australia

,

EUR USD evolueaza in interiorul unei structuri de consolidare ~ forex trading software australia


EUR/USD evolueaza cu eleganta in interiorul unei structuri corective . Recomandarea pentru elevi si abonatii nostri a fost la inceputul acestei saptamani sa scalpeze in interiorul acestei structuri de pret. Evident este o recomandare pe termen scurt. Pe termen mediu consideram ca perechea EUR/USD ar putea sa deschida o miscare ascendenta mai importanta dar aceasta miscare consideram ca se va realiza dupa mijlocul lunii ianuarie. Pana atunci vom exploata potentialul acestui canal de pret corectiv ce credem ca ar putea sa se finalizeze pe zona de suport dinamic al unghiului 8x1 din box-ul nostru de 45 de zile.

Înscrieri la Cursurile de Analiz? Gann ?i abonare la Buletinul de Analiz? S?pt?mânal? Gann pe email
gannmasterforex@gmail.com  si pe Patreon.com

Daca analizele noastre va plac distribuiti link-ul prietenilor dumneavoastra pe canalele de socializare. Doriti sa aflati mai multe despre analiza Gann, puneti intrebari in rubrica noastra de comantarii. Va vom raspunde pe blog sau in privat dupa cum doriti.  

More info for EUR USD evolueaza in interiorul unei structuri de consolidare ~ forex trading software australia:
Read more

Selasa, 29 Maret 2016

The WMA Daily Trend Catcher - forex market hours monitor v3

,

The WMA Daily Trend Catcher ~ forex market hours monitor v3


The WMA Daily Trend Catcher

The WMA Daily Trend Catcher works best on the Daily timeframe for jumping on board big
trends.
In truth, you’re going to get a few losing trades before you get huge
winner (but it will be worth it!).
Time Frame: Daily.
Currency pairs: any.
Markets: Forex, Futures, Indicies.

Indicators:
5wma, 15wma and 50wma.

Top Tip: Using Price Action with this system will boost your success by
decreasing the number of losing trades you have.

Long Entry
Buy when 5WMA crosses above 50WMA.
Exit when 5wma crosses below 15wma.

Short Entry
Sell when 5WMA crosses below 50WMA.
Exit when 5wma crosses above 15wma.

Place initial stop loss on the previous high/low swing.
Profit Target optional ratio 1.5 stop loss. (example if stop loss is 100 pips, profit target is 150 pips.)

The WMA Daily Trend Catcher
The WMA Daily Trend Catcher (Buy Example)


The WMA Daily Trend Catcher
The WMA Daily Trend Catcher (Sell Example)


More info for The WMA Daily Trend Catcher ~ forex market hours monitor v3:
Read more

Senin, 21 Maret 2016

Exiting a trade - forex trading hours easter 2015

,

Exiting a trade ~ forex trading hours easter 2015


Exiting Strategies: Targets

Support and Resistance levels
1 Short trades look for recent levels of support. Place your pips a few pips above these areas.
2 long trades look for recent levels of resistance. Place your pips a few pips below these areas.

Exiting Strategies: Dynamic

Trendlines
Short trades, use a trendlines across the top of the price. Draw it as tough you were looking for a long trade. Close short when price closes across trendline.
Long trades, use a trendlines across the bottom of the price. Draw it as tough you were looking for a short trade. Close long when price closes across trendline.

Moving Averages
Short trades, close trades when you get a bullish cross of 2EMA over 5 EMA.
Long trades, close trades when you get a bearish cross of 2EMA under 5 EMA.

Divergence
Short trades, when bullish divergence shows up, close the trade when you get a bullish Stochastic crossover.
Long trades, when bearish divergence shows down, close the trade when you get a bearish Stochastic crossover.
More info for Exiting a trade ~ forex trading hours easter 2015:
Read more
 

Forex Trading Strategy Copyright © 2016 -- Powered by Blogger