Tampilkan postingan dengan label fibonacci. Tampilkan semua postingan

Senin, 23 Mei 2016

10 lucruri pe care ar trebui sa le stiti despre sirul Fibonacci - forex market hours over xmas

,

10 lucruri pe care ar trebui sa le stiti despre sirul Fibonacci ~ forex market hours over xmas


Despre numerele si ratiile Fibonacci s-a scris mult si cu siguranta se va mai scrie. Nu cred ca exista
trader in lume care sa nu le fi folosit in analizele lor desi sunt destul de convins ca foarte multi dintre
acestia o fac impropriu. Pentru cei care se gasesc la inceput de drum in trading cred ca merita sa scriem  cateva lucruri despre numerele Fibonacci.
1) Numerele Fibonacci sunt 1,1,2,3,5,8,13,21,34,55,89,144,233,377,610 etc.
2)Nu trebuie sa va straduiti sa le invatati, cred ca mai util este sa stiti cum sa le calculati. Adunati ultimele doua numere din secventa Fibonacci si asa o sa aflati numarul Fibonacci urmator. Exemplu 3+5=8; 5+8=13; 8+13=21; 13+21=35 etc.
3)Daca dupa primele 4 numere, vom imparti un numar Fibonacci la numarul ce il precede in sirul numerelor Fibonacci vom obtine o ratie egala cu 1.618. Exemplu: 34/21=1.618. Daca vom imparti un numar Fibonacci la numarul ce il urmeaza in sirul Fibonacci vom obtine o ratie egala cu 0.618. Exemplu 34/55=0.618.
4)Ratia inversa a lui 1.618 este 0.618 si viceversa.Ratia inversa lui 0.618 este 1.618.Exemplu 1/0.618=1.618 si 1/1.618=0.618.
5)Daca o sa impartiti orice numar Fibonacci la numarul care il preced cu doua locuri in sirul Fibonacci, o sa obtinem  ratia 2.618. Daca vom imparti acelasi numar la numarul ce il precede cu doua locuri in sirul lui Fibonacci vom obtine ratia 0.382. Exemplu: 55/144=0.382
6)Inversul ratiei 2.618 este 0.382 asa cum inversul ratiei 0.382 este 2.618. Exemplu: 1/2.618= 0.382; 1/0.382= 2.618.
7)Daca vom imparti orice numar Fibonacci la numarul ce se afla inaintea lui cu trei locuri in sirul Fibonacci vom obtine ratia 4.236. Exemplu: 144/34=4.236. Daca vom imparti acel numar la numarul care il urmeaza in sirul lui Fibonacci cu trei locuri vom obtine o ratie de 0.236. Exemplu: 144/610=0.236.
8)Ratia inversa ratiei 4.236 este 0.236 iar ratia inversa lui 0.236 este 4.236. Exemplu:1/4.236=0.236;1/0.236=4.236.
9)Ratia 1 este expresia comparatiei dintre primele doua numere din sirul Fibonacci; 1_1=1. Ratia 0,5 este expresia dintre cel de-al doilea si al treilea numar din sirul Fibonacci; 1_2=0,5
10)Numerele Fibonacci in sine nu au nici o utilitate in prognoza evolutiei pietelor din perspectiva pretului si a timpului. Cheia elementelor este data de ratiile dintre numere in secventa.

Înscrieri la Cursurile de Analiz? Gann ?i abonare la Buletinul de Analiz? S?pt?mânal? Gann pe email
gannmasterforex@gmail.com  si pe Patreon.com

Daca analizele noastre va plac distribuiti link-ul prietenilor dumneavoastra pe canalele de socializare. Doriti sa aflati mai multe despre analiza Gann, puneti intrebari in rubrica noastra de comantarii. Va vom raspunde pe blog sau in privat dupa cum doriti.  

More info for 10 lucruri pe care ar trebui sa le stiti despre sirul Fibonacci ~ forex market hours over xmas:
Read more

Jumat, 20 Mei 2016

McDonalds Surprise Alarm App - forex trading youtube videos

,

McDonalds Surprise Alarm App ~ forex trading youtube videos


McDonalds Surprise Alarm App

Have you ever wondered why McDonalds are always the fast food restaurant with the longest queue?
I dont know about you, but the way i see it, its because of people
like me (cheapskate you would say...haha) using their free rewards app McDonalds Surprise Alarm App redeeming free food or food at discounted prices.
If its not about food, they
give you a quote of the day as consolation. 
But hey, whos complaining? 
Its an alarm, its a reward, its free!


How do you use the app?
You can download the app here.
After you have downloaded the app and created an account with them, you can set the time for your reward straightaway!

1) Tap on alarm


2) Tap on the hour, minute or am/pm and move the rim (yellow) to change the settings. You can also tap on the days you prefer the alarm to set off. (I just tap every day.)
Once you are done, tap save and you are 24 hours away from your next reward 
To redeem, just show your winning screen to the friendly McDonalds staff at the counter (you have 48 hours to claim your reward before it expires)
3) Tap on redeem once and in the next screen, tap redeem again until you see the 2 minute timer starts to count down

Congrats! You just saved yourself a few dollars. 

P.S - Ensure you have data connection when your alarm rings or you will not receive any prize. (by the way, it is very persistent and will continue to ring if you ignore it.) Also ensure you have data connection when you are redeeming your prize at the counter. 

PP.S - Reward works only once in 24 hours so do not attempt to set it for every minute. (coz ive tried it...)


Download from Google Playstore or Appstore


More info for McDonalds Surprise Alarm App ~ forex trading youtube videos:
Read more

Rabu, 18 Mei 2016

Forex Trading Strategy 134 - forex trading with 200 dollars

,

Forex Trading Strategy 134 ~ forex trading with 200 dollars


Market Analysis of the 27th of October 2014 : Opportunities on EUR/USD, GBP/USD, USD/JPY, USD/CHF, AUD/USD, XAU/USD, EUR/JPY, USD/CAD & NZD/USD D1
Click on the Menu on "Market Analysis" for all the analysis.

No big change compare to last week: The pairs had a first retrace but we have no sign of divergence between the price and the Ewave for most of them so it could be the "a" move of the a-b-c corrective wave 4 or we could get more trades in the direction of the main trend. Therefore the situation is not clear for H1-H4
 

More info for Forex Trading Strategy 134 ~ forex trading with 200 dollars:
Read more

Minggu, 01 Mei 2016

Forex Trading Strategy 132 - forex trading work from home

,

Forex Trading Strategy 132 ~ forex trading work from home


Market Analysis of the 3rd of November 2014 : Opportunities on EUR/USD, GBP/USD, USD/JPY, USD/CHF, AUD/USD, XAU/USD, EUR/JPY, USD/CAD & NZD/USD D1

Click on the Menu on "Market Analysis" for all the analysis.

We have second push of the wave 3 on EUR/USD, NZD/USD and USD/CHF, AUD/USD is officially in wave 4, wave 5 has started on the JPY pairs and on XAU/USD; Therefore no setup on the daily chart (potential wave 5 to be spotted on AUD/USD later this week). H1/H4 trades potentials on the pairs which where the daily alligator is open (EUR/USD, NZD/USD, USD/CHF and XAU/USD mainly)

For more details, click  "Signals" in the menu


More info for Forex Trading Strategy 132 ~ forex trading work from home:
Read more

Rabu, 27 April 2016

Fibonacci levels support and resistance - forex trading hours utc

,

Fibonacci levels support and resistance ~ forex trading hours utc


The Fibonacci sequence describes key ratios from growth in plants, human anatomy, and so on. The forex application is to price movements, which appears to realize Fibonacci ratios. This is particularly obvious on larger time frames such as weekly, daily, and 4-hour time charts. A large move from a low to a high is often followed by an attempt of the price to move back or “retrace” the original move. These areas of rest are Fibonacci points. For example, let’s look at a chart showing a price move on the euro–U.S. dollar (EURUSD) 4H chart chart (see picture1).
We can see that the EURUSD made a low at 1.3525 and then proceeded to forma high at 1.3637. Once this move was completed, the trader can use a Fibonacci (Fib) graphic tool, which is available on all platforms to draw a Fib line. The Fibonacci retracement are:
23.6% the shallowest of the retracements;
38.2% this is the first line of defense of the current trend.;
50% the neutral point of any retracement.;
61.8% retracing to this typically signals a breakdown in the trend;
100% matching the move;
other potential lines are: 138.2% , 161.8%, 200%.
Since the price started from the low, the Fib tool assigns the 100 percent level to this origin point. The best way to interpret this is to think of the price going all the way back home to where it started. It would achieve a 100 percent retracement. Once the low and the high are connected, the Fib graphic tool draws the lines and projects it out. Notice that these Fib lines are extended into the future. The trader doesn’t know if the price will get there! The trader makes the assumption that if the price is able to get to a Fib level, it will experience strong support or resistance. Also, if the price is able to probe a future Fib level but fails to go through it, the trader can make a reliable assumption that there is key support at that level.The price moved from the low of point A to the high of point B and then proceeded to retrace or fall back.
The Fibonacci levels are maps of potential support or resistance. They are areas where great care should be taken by the trader. Rest assured that any professional trader knows where the key Fib levels are. Perhaps because these levels are projected and therefore known in advance, they generate a self-fulfilling process and increase in importance.
Fibonacci levels support and resistance
The price moved from the low of point A to the high of point B and then proceeded to retrace or fall back


Fibonacci Quiz

1. What are the Fibonacci levels ?
  • 0.236%, 38.2%, 50%, 61.8%
  • 1.23%, 0.38%, 0.61%, 0.76%
  • 50.0%, 12.3%, 63.8%, 92.7%
2. What may represent Fibonacci levels?
  • Fibonacci levels are only imaginary points
  • Fibonacci leveles are dynamic points
  • Fibonacci levels are potential areas support or resistance
3. (Fib) Graphic tool what to do?
  • Draws magic lines for fx prediction.
  • Draws the ratio of Elliott wave
  • Draws the ratio lines and projects it out
4. What are the best time frame where to apply Fibonacci lines?
  • All time frame are good
  • 4H, daily, weekly, monthly
  • 1 min, 1 sec, 5 min, 10 min
Score =

Correct answers:

More info for Fibonacci levels support and resistance ~ forex trading hours utc:
Read more

Sabtu, 23 April 2016

Fibonacci basic tutorial - forex market hours gadget windows

,

Fibonacci basic tutorial ~ forex market hours gadget windows


My experience makes me a believer in the adage that there is a natural order in the markets that has more geometric symmetry than most traders realize or want to believe. This is a fact, not subjective, because almost all market turning points adhere to a certain numerical sequence that you can prove to yourself by looking at historical charts. This sequence applies to both price and time. The primary tool used for this trade analysis is Fibonacci relationships. They include Fibonacci retracements and extensions, as well as time measurement, pivot dates by ratio and numerical sequence.
There is no need to go into the history of Fibonacci, other than to know it is the force that rules the movement of about anything you can imagine, including the financial markets.
The Fibonacci series is a numerical sequence that expands by adding the previous numbers together as shown here:
1, 1, 2, 3, 5, 8, 13, 21, 34, 55, 89, 144, 233, 377, 610, 987, 1597, 2584, 4181, etc.
Fibonacci
The most interesting property of this numerical sequence is that as the series proceeds, any number is 1.618 times the preceding number, and 0.618 of the next number.
Example:
1.618 x 34 = 55 x 1.618 = 89 x 1.618 = 144.
.618 x 55 = 34, .618 x 89 = 55, .618 x 144 = 89.
The .618 and 1.618 numbers are what they call the Golden Numbers. You will also see the sequence root of .618, which is .786, and 1.272, the square root of 1.618, occur frequently in your trading.
Suffice to say, the Golden Numbers are dominant in math, nature and science. Planets revolve around the Golden Number, as does your heartbeat on an EKG, and even the index finger on your hand. Each section of your index finger, from the tip to the base of the wrist, is larger than the preceding one by about the Fibonacci ratio of 1.618. And lastly, they tell us that the Egyptian pyramids are based on the Golden Ratio/Numbers.
Key Point:  My source for all of this trivia is goldennumber.net, but you can just go to Google.com and find any number of sites that give you this background in volume. If you believe it, I can teach you how to use it in a pragmatic way trading and investing in the markets.
Key Point:  In spite of all the financial, economic and geopolitical events that affect the markets, you will see beyond any doubt that the up and down price fluctuations in all major markets are governed by the Fibonacci Golden Ratio.
Fibonacci is a sequence tool that is excellent by itself and that becomes very powerful when combined with volatility bands and standard deviation, let alone any of the other tools.
Fibonacci Retracement
I use the following Fib retracement ratios:
  • .236
  • .382
  • .50
  • .618
  • .786
  • 1.00
The minor ratio that will come into play sometimes is the .707 Fib retracement (square root of .50).

Retracements depict the potential reversal levels, support and resistance.
To calculate a retracement in an uptrend, which is when a stock rallies and then pulls back to some percentage ratio of the previous swing point low, you would do the following:
  • High - Low x Fib Ratio, then subtract it from the High.


  • Calculation of .618RT level    

        60 - 40 = 20 x .618RT = 12.36
        60 - 12.36 = 47.64 (.618RT level)
  • Complete the other ratios for practice.
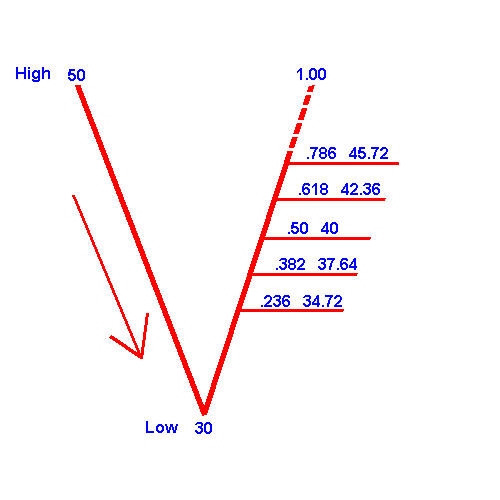
  • To calculate a retracement in a downtrend, which is when a stock declines and then pulls back to some percentage ratio of the previous swing point high, you would do the following:
    • High - Low x Fib Ratio, then add it to the Low.
    • Calculation of .382 level

          50 - 30 = 20 x .382 = 7.64
          30 + 7.64 = 37.64 (.382RT level)
       
      mplete other ratios for practice
    • fibonacci retracement

    • Fibonacci Extensions
      I use the following Fib extensions ratios:
      • 1.272
      • 1.618
      • 2.00
      • 2.24
      • 2.618
      • 3.14 (Pi -- Key ratio)
      • 4.236 
      These extensions occur after price exceeds the 1.00 level and makes new lows or new highs beyond the last leg.
      A minor extensions ratio that will come into play sometimes is the 1.414.
      To calculate a Fib extension after price exceeds the low or high of the last leg, you would:
      Extension down
      • High - Low x Ratio, then subtract from the High.
      Calculation of 1.272 extension down

          90 - 80 = 10 x 1.272 = 12.72
          90 - 12.72 = 77.28
       Extension Up
      • High - Low x Ratio, then add to Low.
      • Calculation of 1.618 extension up

            90 - 80 = 10 x 1.618 = 16.18
            80 + 16.18 = 96.18

         
      • We have given you some Fibonacci background, and the basics of calculating the retracements and extensions, in addition to the ratios that I suggest you use. Now we will build on that.
        Key Point:  When you look at retracements and extensions in terms of price, you should also look for symmetry of time using the same ratios. It is not mandatory that you have both, but it is much better symmetry when you do, which builds your case for higher probability.
        Key Point:  Once you have identified a high-probability zone, it is the price action at that zone that determines what you will do.
        The following SPX charts will demonstrate retracement, extension, time and price action at different zones.
        Fibonacci tutorial
        Fibonacci Tutorial 
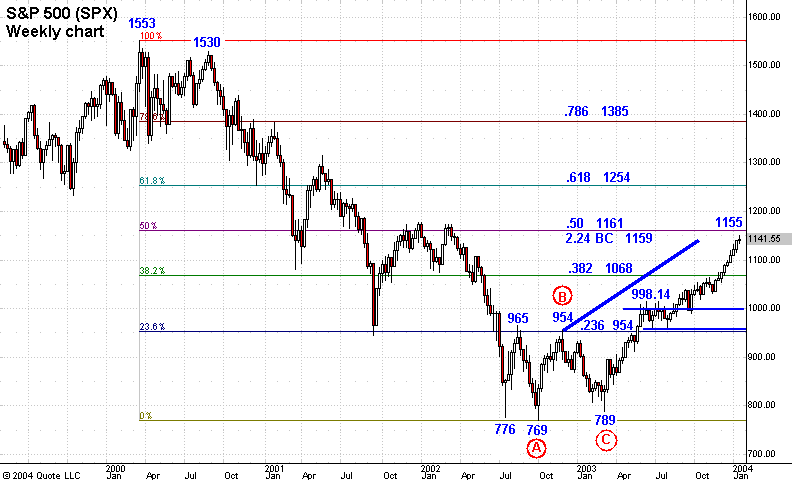
    • This SPX weekly chart frames the Fibonacci retracement levels between the 1553 top and 769 bottom. You can see that the .236RT to 1553 of 954 was a major obstacle. The first rally from 776 reached 965, but didnt close above it.
      From 965, the SPX declined to the 769 bottom (A) and then rallied to 954, right at the .236RT level, but failed to close above 954. The next leg down (BC) made a 789 low, then reversed to the upside and approached the .236RT level for the third time.
      Key Point:  The more price trades at resistance or support, the weaker the line is and the probability of penetration increases.
      Price breaks above 954 and trades to the 1015 level. The 1.272 Fib extension of the BC leg is 999, and for 12 weeks, the SPX traded sideways with a high close of 998.
      Key Point:  If price breaks out of a range at a Fib level, the highest probability is that it will seek the next level.
    • The .382RT to 1553 is 1068, and that is exactly where the SPX traded and went sideways for four weeks (more detail on next chart) before breaking out and trading to the next Fib zone, which is the .50RT to 1553 of 1161. Notice also that there is a confluence with the 2.24 Fib extension of the BC leg at 1159. At the completion of this course on Jan. 29, 2004, 1155 is the rally high on Jan. 27, the SPX had traded down to 1122.38.
      This chart demonstrates the natural order that the SPX has traded just using Fib retracements, extensions and time, which you will see better on the next chart. You have anticipated the key zones in advance.
    • On this chart, we will start with the time symmetry that is present in this move.
    • The BC leg from 954 - 789 was 14 weeks to the low and 13 weeks (Fib number) to the low close. Any reversal bar setup right there had to be taken. The 789 low week was a reversal bar (Hammer) with a high of 841.39. Sequence traders took entry.
      Now it gets more interesting. Once price broke out above 954, you had anticipated the 1.272 zone, but on this chart, you also see that the last low in that zone was week 21 following the 789 low week. 21 is the 1.618 Fib extension of 13. Price then rallied, breaking out of the 1.272 zone range.
      Key Point:  When looking for time symmetry, you can use the low close or low, and measure it with a high close or high. That will all be considered symmetry.
    • After the 1.272 breakout, the SPX traded right up to the .382RT zone at 1088. The first weekly bar in that range was the 34th week, and price went sideways for four to five weeks with a high of 1064. Once again, there was price and time symmetry, as 34 (Fib number) is the 2.618 Fib extension of 13.
      The advance above the .782RT level means anticipation of the next Fib RT zone, which would be the .50RT to 1553 at 1160. There is also a .50RT to the 1530 secondary high of 1150, and then the 2.24 Fib extension of the BC leg at 1159. The 1530 high was the 1,2,3 lower top to the 1553 all-time high after the initial decline to below 1350 from 1553. That would make it a significant high to measure a retracement.
      From a time perspective, the 1155 high is Week 46 and the high close is Week 45. The 3.14 Fib extension of 14 is 44.
      Review these two charts several times so you gain a good idea of the structured way a market trades most of the time and enables you to anticipate high-probability zones where you will take some kind of action, either buy or sell, but it is never nothing.

More info for Fibonacci basic tutorial ~ forex market hours gadget windows:
Read more

Minggu, 17 April 2016

5 min Bollinger Bands Intraday System - forex trading times gmt

,

5 min Bollinger Bands Intraday System ~ forex trading times gmt


On a chart of 5-minute bars for a stock, plot out the 10-bar moving average and the Bollinger bands for 2 standard deviations on either side of the average. Then apply the following system:
Buy when the stock falls 3 percent below its lower band. Hold until at least the end of the 5-minute bar where the stock was bought.
Sell when the stock hits a 1 percent profit target or at the end of the second bar after the stock was bought.
The critical issue is how to keep track of all the stocks one is interested in. Before the open, use charting software such as eSignal or TradeStation, or Wealth-Lab (which is the software I use for all of my testing) to identify the Bollinger band levels for each stock. It is then possible with all of these packages to set up alerts and even interface with direct-access brokers, such as Interactive Brokers or Cybertrader, to actually make the trades automatically.
The key in all of these examples is time. Basically, the market has such an
extreme and quick selloff in order to trigger this system that the stock ei-
ther bounces back immediately or flounders about. If the latter, then we
promptly get out since we are only looking for our profit target within the
ten minutes following the entry bar.
ORCL, 5/20/2002, 10:30 AM

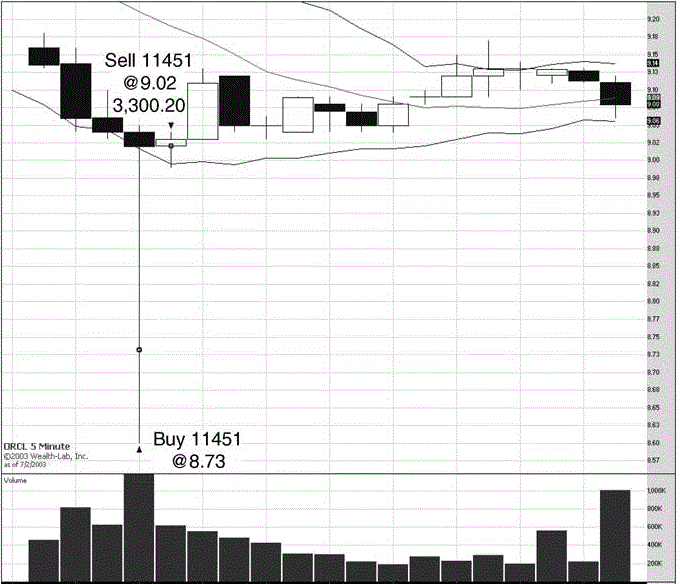
Merrill Lynch, in a post-Blodget fury of tech pessimism, reiterated a broads weeping recommendation the morning of May 20, 2002, to sell technology stocks into any strength. While their prediction proved mildly prophetic for all of two months, anybody short technology at May 2002 levels would have been killed over the following year. Nevertheless, the panic to get out of the popular tech issues, for instance ORCL, was enough to trigger a signal on ORCL at 10:30 AM at 8.73 (1). In a brief flurry of selling, it hit 3 percent below its lower band, which it had been steadily walking down all morning. Buying at the critical level and holding until the open of the next 5-minute bar would have resulted in a quick 3.3 percent profit with the sale at 9.02.
5 min Bollinger Bands System
MSFT, 4/3/2000
Many of examples occur close to the open of the day, which is the time when there is the most volatility and also the most panic. The market has had all night to hear and absorb news, and thus the open is when the most participants at once are acting on that news.
Look at Figure 2. On April 3, 2000, MSFT gapped down and triggered signals for two five-minute bars in a row, at 9:30 AM at the open and 5 minutes later at 9:40 AM . The first signal was sold off at the close of the second bar at 47.69 for a 1 percent profit, and the second signal, which was bought at the open of the second bar at 47.44, was promptly sold at 47.91 for a 1 percent profit.
5 min Bollinger Bands Intraday System
AMAT, 11/12/01
On the morning of November 12, 2001, a plane crashed near Kennedy air port. The crash was not apparently an act of terrorism but nobody knew that at the time. Futures spiked lower and the tech stocks, which were hit hardest during the week after September 11, 2001, suffered a minicrash im-
mediately prior to the open. Being alert and capitalizing on the panic would have enabled one to buy AMAT, which triggered a buy signal at its premarket low at 18.20 when it hit 3 percent lower than its lower Bollinger band (Figure3, . Holding to the close of that 5-minute bar would have enabled one to sell immediately at 19.33 for a 6.15 percent profit.
5 min Bollinger Bands Intraday System
 
5 Min BB System, 2/2/02–6/30/03 results
 

You can apply this system also at the Forex Majors (with 20-30 pips outside the bands).


More info for 5 min Bollinger Bands Intraday System ~ forex trading times gmt:
Read more

Rabu, 13 April 2016

CCI Trade Momentum - forex market hours singapore

,

CCI Trade Momentum ~ forex market hours singapore


CCI Trade is a forex strategy based on Commody Channel Index. CCI is an indicator that is good for measure of momentum and helps us to optimize best entries in the activity of trading on the financial markets.
CCI (Commodity channel Index is an oscillator (mathematical algorithm). CCI is an unbounded range, typically when your level is above of +100 considered to be overbought, when your level is below -100 is oversold.
We will use these levels as our trigger points as we put a twist on the traditional interpretation of CCI. We actually look to buy if the currency pair makes a new high above 100 and sell if the currency pair makes a new low below -100. In “Trade CCI Momentum” we are looking for new peaks or spikes in momentum that are likely to carry the currency pair higher or lower. The thesis behind this setup is that much like a body hurtled in motion will remain so until it’s slowed by counterforces, new highs or lows in CCI will propel the currency further in the direction of the move before new prices finally put a halt to the advance or the decline.

Trade CCI Momentum Buy
1. On the daily or the hourly charts place the CCI indicator with standard input of 20.
2. Note the very last time the CCI registered a reading of greater than +100 before
dropping back below the +100 zone.
3. Take a measure of the peak CCI reading and record it.
4. If CCI once again trades above the +100 and if its value exceeds the prior peak reading,
go long at market at the close of the candle.
5. Measure the low of the candle and use it as your stop.
6. If the position moves in your favor by the amount of your original stop, sell half and
move stop to breakeven.
7. Take profit on the rest of the trade when position moves to two times your stop.

Trade CCI Momentum Sell
1. On the daily or the hourly charts place the CCI indicator with standard input of 20.
2. Note the very last time the CCI registered a reading of less than -100 before poking
above the -100 zone.
3. Take a measure of the peak CCI reading and record it.
4. If CCI once again trades below the -100 and if its value exceeds the prior low reading,
go short at market at the close of the candle.
5. Measure the high of the candle and use it as your stop.
6. If the position moves in your favor by the amount of your original stop, sell half and
move the stop on the remainder of the position to breakeven.

7. Take profit on the rest of the trade when position moves to two times your stop.
CCI Trade Momentum
 In this daily chart of the EUR/USD pair we see that the former peak high above the CCI +100 level
was recorded on September 5, 2005, when it reached a reading of 130.00. Not until more than three
months later on December 13, 2005, did the CCI produce a value that would exceed this number.
Throughout this time we can see that EUR/USD was in a severe decline with many false breakouts
to the upside that fizzled as soon as they appeared on the chart. On December 13, 2005, however,
CCI hit 162.61 and we immediately went long on the close at 1.1945 using the low of the candle
at 1.1906 as our stop. Our first target was 100% of our risk, or approximately 40 points. We exited
half the position at 1.1985 and the second half of the position at two times our risk at 1.2035. Our
total reward-to-risk ratio on this trade was 1.5:1, meaning that if we were merely 50% accurate,
the setup would have positive expectancy. Note also that we were able to capture our gains in less
than 24 hours as the momentum of the move carried our position to profit very quickly.
For those traders who do not like to wait nearly a quarter of a year between setups, the hourly chart
offers far more opportunities of the “Trade CCI Momentum” setup. It is still infrequent, which is one of the reasons that makes this setup so powerful (the common wisdom in trading is: the rarer the trade the better the trade). Nevertheless it occurs on the hourly charts far more often than on the dailies.
In the above example, we look at the hourly chart of the EUR/USD between March 24 and March
28 of 2006. At 1pm on March 24, 2006, the EUR/USD reaches a CCI peak of 142.96. Several
days later at 4am on March 28, 2006, the CCI reading reaches a new high of 184.72. We go long
at market on the close of the candle at 1.2063. The low of the candle is 1.2027 and we set our stop
there. The pair consolidates for several hours and then makes a burst to our first target of 1.2103
at 9am on March 28, 2006. We move the stop to breakeven to protect our profits and are stopped
out a few hours later, banking 40 pips of profit. As the saying goes, half a loaf is better than none,
and it is amazing how they can add up to a whole bakery full of profits if we simply take what the
market gives us.

Here is an example of a short in USD/CHF trade on the dailies that employs this approach in
reverse. On October 11, 2004 USD/CHF makes a CCI low of -131.05. A few days later, on October
14, 2004, the CCI prints at -133.68. We enter short at market on the close of the candle at 1.2445.
Our stop is the high of that candle at 1.2545. Our first exit is hit just two days later at 1.2345. We
stay in the trade with the rest of the position and move the stop to breakeven. Our second target is
hit on October 19, 2004 - no more than five days after we’ve entered the trade. Total profit on the
trade? 300 points. Our total risk was only 200 points, and we never even experienced any serious
drawdown as the momentum pulled prices further down. The key is high probability, and that is
exactly what the “Trade CCI Momentum” setup provides.
At 9pm on March 21, 2006, EUR/JPY recorded a reading of -115.19 before recovering above the
-100 CCI zone. The “Trade CCI Momentum” setup triggered almost to the tee five days later at 8pm on March 26, 2006. The CCI value reached a low of -133.68 and we went short on the close of the
candle. This was a very large candle on the hourly charts, and we had to risk 74 points as our entry
was 140.79 and our stop was at 141.51. The majority of the traders would have been afraid to enter
short at that time, thinking that most of the selling had been done. But we had faith in our strategy
and followed the setup. Prices then consolidated a bit and trended lower until 1pm on March 27,
2006. Less than 24 hours later we were able to hit our first target, which was a very substantial 74
points. Again we moved our stop to breakeven. The pair proceeded to bottom out and rally, taking
us out at breakeven. Although we did not achieve our second target overall, it was a good trade as
we banked 74 points without ever really being in a significant drawdown.
Finally, our last example shows how this setup can go wrong and why it is critical to always use
stops. The “Trade CCI Momentum” setup relies on momentum to generate profits. When the momentum fails to materialize, it signals that a turn may be in the making. Here is how it played out on the hourly charts in AUD/USD. We note that CCI makes a near-term peak at 132.58 at 10pm on May 2, 2006. A few days later at 11am on May 4, 2006, CCI reaches 149.44 prompting a long entry
at .7721. The stop is placed at .7709 and is taken out the very same hour. Notice that instead of
rallying higher, the pair reversed rapidly. Furthermore, as the downside move gained speed prices
reached a low of .7675. A trader who did not take the 12-point stop as prescribed by the setup
would have learned a very expensive lesson indeed as his losses could have been magnified by a
factor of three. Therefore, the key idea to remember with our “Trade CCI Momentum” setup is - “I
am right or I am out!
How can you improve this forex strategy?
adding 2 exponential moving averages.
The new setup of this strategy is as follows (h1 time frame)
CCI 20 periods,
 EMA 9 periods ,
EMA 21 periods.
H4 and daily time Frame setup is:
CCI 20 periods,
 EMA 6 periods,.
EMA 13 periods.

Buy
The same previous rules but with conditions That 9EMA> 21 EMA.
Sell
The same previous rules but with conditions That 9EMA< 21 EMA.

To see example
Trade CCI Momentum
Trade CCI Momentum
For a more aggressive trading this strategy can be summarized in the following way:
Buy
CCI> 100 and 9EMA> 21EMA;
Sell
CCI <-100 and 9EMA <21EMA
Trade CCI Momentum
trade CCI Momentum


More info for CCI Trade Momentum ~ forex market hours singapore:
Read more

Sabtu, 02 April 2016

Azi suntem à ntr o zi Fibonacci - forex trading software companies

,

Azi suntem à ntr o zi Fibonacci ~ forex trading software companies


Azi suntem într-o dat? calendaristic? Fibonacci: 1123.
De ce este o dat? Fibonacci? Simplu, pentru c? avem o secven?? Fibonacci. Dup? cum ?tim, ?irul numerelor Fibonacci începe cu 1, urmat de 1, apoi suma celor dou? numere , adic? 1+1=2, ?i evident urmeaz? suma ultimelor dou? numere, 1+2=3. Suntem în luna a 11, ziua 23, deci suntem într-o superb? zi Fibonacci.

More info for Azi suntem à ntr o zi Fibonacci ~ forex trading software companies:
Read more

Kamis, 24 Maret 2016

Forex Trading Strategy 1 - forex trading yang aman

,

Forex Trading Strategy 1 ~ forex trading yang aman


3 x 21

Conditions required:
1) Moving average 3
2) Moving average 21
3) H1, H4 and D1 charts

As the name suggest, this strategy has something to do with 3 and 21. And the reason being
to set 2 moving average lines as 3(blue line) and 21 (green line). These 2 lines will follow the trend of the market and moves up and down with the market.

Once they cross each other, it gives us the signal to start firing!
As shown in the chart above, the blue line (3) crosses the green line (21) indicating a possible down trend coming. But we cannot confirm that this is actually happening until we see the next bar in the next hour, therefore we need to wait for the confirm bar to come out before firing our trade as there is always a chance that it may go against our direction. Though you may by all means fire if you are confident. :)

Another example is show on the right of the chart indicating an up trend. Are you able to spot without any explanation?

However, to be certain of the trend, you will need to look at the H4 and D1 charts. Generally if the trend is going our way, we can take a 20 to 30 pip profit.

If at this point, you are still unsure of the 3 line and 21 line thingy, no worries. Let me put it this way, imagine a person carrying a 3 kg load versus 21 kg. It is definitely easier to lift up the 3 kg than 21 kg load, therefore indicating up trend when 3 is higher than 21.

On the reverse, it is more difficult to carry 21 kg load over a 3 kg, therefore indicating a down trend.

More examples below. Can you spot the up trends and down trends? The crossovers and confirm?
Blue line = 3
Green line =21


More info for Forex Trading Strategy 1 ~ forex trading yang aman:
Read more

Senin, 21 Maret 2016

Two line MACD with EMAs and Fibonacci retracement - forex trading hours during christmas

,

Two line MACD with EMAs and Fibonacci retracement ~ forex trading hours during christmas


This is a trend-following system based on the use of several indicators; two EMAs (Exponential Moving Averages), and the MACD (Moving Average Convergence Divergence). I will
also be using the Fibonacci Retracement tool to help determine support and The EMAs are used as opposed to the SMAs (Simple Moving Average) because I feel it provides a faster reaction to the trend. There are three main representations of the MACD; the “One-lined” MACD, which has one line overlaying the histogram; the “Two-lined” MACD, which depicts two lines overlaying the histogram; and the OsMA (short for Oscillator of the Moving Average), which displays only the histogram. In this system, we will use the two lined MACD. On the 1-hour chart, this system requires the use of the two lines of the MACD to help determine the trend, but on 5-minute chart, it only uses the Histogram. We’ll add the 7 EMA, 13 EMA and MACD (we’ll use the default settings for MACD - 12, 26, 9). 7 EMA and 13 EMA Settings:
I. Period: 7 and 13
II. Shift: 0
III. MA Method: Exponential
IV. Apply to: Close.

Find your most recent swing points to draw your Fibonacci.

Trading rules Two line MACD with EMAs

Long Trades
1. The 7 EMA needs to be above the 13 EMA on the 1 hour chart.
2. MACD should be crossed over to the up side on the 1 hour chart.
3. Find your most recent swing points and draw your Fibonacci
retracement. Wait for price to retrace to at least the 38.2% retracement
level and no more than the 78.6% retracement level on the 1 hour chart.
4. Go to your 5 min chart for entry. Ensure at least one candle on the
M5 timeframe closes below the 38.2% Fibonacci retracement level. Wait
until the MACD Histogram forms a new bar above the zero line, then
enter the market with a buy trade at the close of that candle.
5. Stops and limits can be based on previous swing highs and lows on
the five minute or hourly charts. I personally use a 15 to 20 pip stop
based on my entry point. You have to decide this based on your own
risk/reward tolerance. Never risk more than what you see as your profit
potential.

Short Trades
1. The 7 EMA needs to be below the 13 EMA on the 1 hour chart.
2. MACD should be crossed to the down side on the 1 hour chart.
3. Find your most recent swing points and draw your Fibonacci
retracement. Wait for price to retrace to at least the 38.2% retracement
level and no more than the 78.6% retracement level on the 1 hour chart.
4. Go to your 5 min chart for entry. Ensure at least one candle on the
M5 timeframe closes above the 38.2% Fibonacci retracement level. Wait
until the MACD Histogram forms a new bar below the zero line, then
enter the market with a sell trade at the close of that candle.
5. Stops and limits can be based on previous swing highs and lows on
the five minute or hourly charts. I personally use a 15 to 20 pip stop
based on my entry point. You have to decide this based on your own
risk/reward tolerance. Never risk more than what you see as your profit
potential.

Fibonacci Retracement
After you have determined your trend as depicted by the EMAs and the MACD,
you want to look for your most recent swing points (swing-highs & swing-
lows). A swing-high is the highest point of the highest candle in a price
movement. A swing-low is the lowest point of the lowest candle or bar in a
price movement. In other words, a swing-high candle must be preceded by a
candle that has its high point lower AND the subsequent candle must also
have its high point lower. Conversely, the swing-low candle must be preceded
by a candle that has its low point higher AND the subsequent candle must also
have its low point higher. The Fibonacci tool is then used to determine a higher
probability retracement once the swing-low and swing-high are established. A
minimum retracement of 38% is required, as seen in the chart below:
Two line MACD with EMAs and Fibonacci retracement

A few candles earlier from the chart above, we see that the EMAs came into
bullish alignment, as well, however, once the Fib tool was applied to the chart,
we see that the market continued to retrace beyond the 78% level nullifying
the move as seen below:
Two line MACD with EMAs and Fibonacci retracement


However, as we patiently waited for market movement, we see that the bullish
trend reaffirmed (EMAs and MACD re-aligned) and subsequently retraced to
an appropriate level:


Entry
Once the requirements for determining the trend have been satisfied on the
1-hour chart, I drop down to the 5-minute chart to pin-point my entry. Only
the MACD Histogram is used at this time. When a histogram bar pops up from
below the zero line, this signals a bullish entry. A bearish entry is confirmed
when a histogram bar appears below the zero. Also, please take note, in my
videos, I often times refer to the “zero line” as the “water line”.
Remember, the 1-hour chart is used to determine the trend,
and only the 5-min chart is used for the actual entries.
Below is an example of a 5-min entry signal:


Short/Sell Trade Examples
EURUSD
The 1 Hour Chart


The 7 EMA is below the 13 EMA. The MACD is crossed down at point (A). All
points are marked on the chart. Find your most recent swing points to
measure your Fib retracement from. I have drawn my Fib Line using the most
recent swing points.
Price has retraced above 50% and
The 5 Min Chart


At point C the histogram has gone below the zero line. At point D enter short
at the close of that candle, because the histogram has gone below the zero
line. Point D marks the entry. Your limit can be the previous swing low on the
1 hour chart or a pivot point. Your stop can be a previous swing high on the 1
hour chart or a pivot point. You have to decide that based on your risk vs.
your reward. Price fell over 100 pips.
Buy/Long Trade Examples
GBPUSD
The 1 Hour chart


The 7 EMA is below the 13 EMA. The MACD is crossed down at point (A). All
points are marked on the chart. Find your most recent swing points to
measure your Fib retracement from. I have drawn my Fib Line using the most
recent swing points.
Price has retraced above 50%  


At point C the histogram is above the zero line. At point D enter long at the
close of that candle, because the histogram is above the zero line. The arrow
at point D marks the entry. Your limit can be the previous swing high on the
1 hour chart or a pivot point. You have to decide that based on risk vs. reward.
Price went up over 100 pips.  

More info for Two line MACD with EMAs and Fibonacci retracement ~ forex trading hours during christmas:
Read more

Sabtu, 19 Maret 2016

40 pips a day - forex trading hours singapore

,

40 pips a day ~ forex trading hours singapore


40 pips a day is a daily forex strategy very simple but its very impressive. This is an trend momentum trading system.
Currency pairs: EUR/USD, GBP/USD, AUD/USD, USD/CHF, USD/CAD, EUR/JPY, GBP/JPY, AUD/JPY, NZD/USD, GBP/NZD, USD/JPY, and other.

Financial technical indicators:
RSI (Relative Strength Index) 5 periods;
Exponential moving average 5 ema (High);
Exponential moving average 5 ema (Low);
CCI (Commodity Channel Index (11 period level 90, -90).

Enter the trade only after the signaling candle is closed.
Buy
RSI must be over 50 level.
CCI must be over 90 level.
Buy when the price broken and close above the upper band (5EMA high).

Sell
RSI must be less 50 level.
CCI must be over -90 level.
Sell when the price broken and close below the lower band (5EMA low).

Profit Target 40 pips.
Initial Stop loss:
for buy the low of the entry bar;
for sell the hih of the entry bar.

40 pips a day
40 pips a day


More info for 40 pips a day ~ forex trading hours singapore:
Read more

Kamis, 17 Maret 2016

Bollinger Bands System - forex market hours gmt mt4 indicator

,

Bollinger Bands System ~ forex market hours gmt mt4 indicator


The basic idea for using Bollinger bands is that when a stock hits the upper band, it is usually overbought so you should short, and when a stock hits the lower band, it is usually oversold, so you should buy. The rationale is that price tends to revert to its moving average.
Buy when a stock hits the lower band using a 20-day moving average
and 2 standard deviations.

Sell when a stock returns to its moving average.
Bollinger Bands System
figure 1 Bollinger Bands System
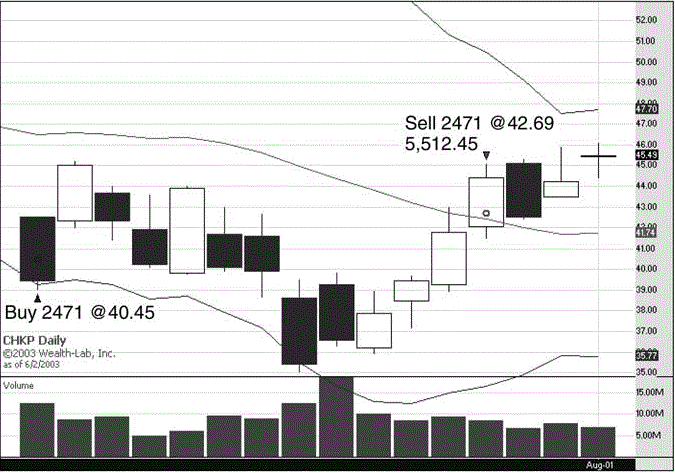
On July 7, 2001, CHKP (shown in Figure 2) gapped down and proceeded to hit its lower Bollinger Band at 40.45. The system held the position until July 27 at 42.69 for a 5.51 percent profit. (See Table 1 for results.)
Bollinger Bands System results
The basic idea holds up and delivers a fairly consistent return with a high probability. There are several twists that I do on the basic system to improve both the odds of success and the percent return per trade. For one thing, I do not like to wait for the stock to return to its moving average.
Even if a company is in big trouble, even going bankrupt (and see Technique 3 on bankruptcies for an example of what I am about to say), stocks do not move in a straight line. The faster the spike down, the more likely the stock is to do a quick bounce up. However, if the company is truly in trouble, over time the stock will do its little spike up and then drift down, bringing the moving average, and the potential for profit, down with it.

Not only am I interested in if the stock simply touches the Bollinger band, but if it decisively breaks through it, which introduces the concept of “per- cent b.” Percent b (%b) is the percent level the stock price is at relative to its bands. If the stock is dead center between the bands, then the %b = 50.
Bollinger Bands System
If the stock is touching the upper band, then the %b is 100, and if it is below the lower band, then the %b is negative. The following formula is used to calculate %b:
Formula Bollinger Bands %
Which all leads to the following:
Buy when %b is less than –20 using Bollinger Bands on the 10-day moving average with 1.5 standard deviations and hold at least until the close of that day even if profit target is hit.
Sell when either a 15 percent profit target is hit or four days go by, whichever comes first. With this system, we are using the 10-day moving average to get quicker and sharper spikes. We use a –20 %b to make sure it is a decisive break of the bands. And if we don’t get our target within four days, then we are run like hell out of the trade.
Example: SEBL, 8/31/98
August 31, 1998. The markets had been in turmoil all summer, culminating in the Long Term Capital Crisis. Panic had set in and everyone was worried the party was over. After nine down days in a row, during four of which the lower Bollinger Band was broken through, the stock price finally hit our buy target at 4.81 on August 31. The next day it bounced, hitting a 15 percent target at 5.54 (see Figure 3).
Example: BRCD,4/14/2000 April 14, 2000, was not a pleasant day to be long tech stocks. In fact, it seemed like the world might quite possibly end. At the time I was working at 44 Wall Street, and when I left the building that evening pedestrians were jokingly being warned to stay away from the sidewalks just in case people were jumping out of buildings. Nevertheless, despite the pain, it was certainly an important day to be buying short-term moves in stocks. As shown in Figure 4, on that day, BRCD triggered a buy signal at 46.42. It started to make a comeback on Monday the 17th and finally hit the 15 percent profit target on the 18th at 53.38. (See results in Table2.)
Bollinger Bands system
Figure 3 Bollinger Bands system


More info for Bollinger Bands System ~ forex market hours gmt mt4 indicator:
Read more
 

Forex Trading Strategy Copyright © 2016 -- Powered by Blogger