Tampilkan postingan dengan label la. Tampilkan semua postingan

Selasa, 24 Mei 2016

Instant Pip Profit - forex market hours gadget

,

Instant Pip Profit ~ forex market hours gadget


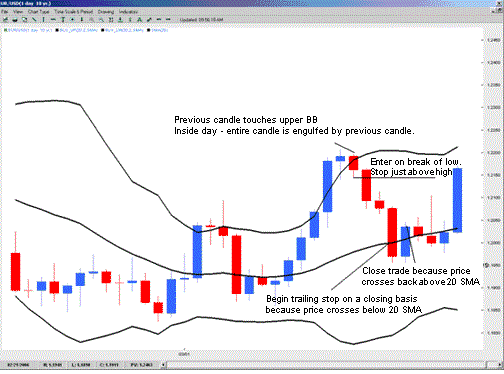
Prices at the upper Bollinger band are considered high and prices at the lower Bollinger band are considered low. However, just because prices have hit the upper Bollinger does not necessarily mean that it is a good time to sell. Therefore, just buying at the lower band and selling at the upper band is out of the question. By definition, price makes new highs in an uptrend and new lows in a downtrend, which means that they will naturally be hitting the bands. With this information in mind, our filter will require that buy signals occur only if the candle following the one that hits the Lower Bollinger band does not make a new low (white candle) and sell signals occur only if the candle following the one that hits the Higher Bollinger band does not make a new high (black candle). This type of candle is commonly known as an inside day. The best time frames to look for the inside days are daily charts, but this strategy can also be used on hourly, weekly and monthly charts. Combining inside days with Bollinger bands increases the likelihood that we are only picking a top or bottom after prices have hit extreme levels. As a rule of thumb, the longer the time frame, the rarer the trade will be, but the signal will also be more significant.
For Buy
1. Look for the currency pair to hit or come very close to hitting the lower Bollinger.
2. Wait for next candle and make sure that the next candles low is greater than or equal to the previous candles low and that the high is also less than or equal to the previous periods high. Basically it should be within the previous candle high and low. Also make sure the candle is while candle. If so, go long at the open of the third candle.
3. The initial stop is placed a few pips below the previous candles low.
4. Trail stop on a closing basis with the 20-period SMA.

For Sell
1. Look for the currency pair to hit or come very close to hitting the upper Bollinger.
2. Wait for next candle and make sure that the next candles high is less than or equal to the previous candles high and that the low is also greater than or equal to the previous periods low. Basically it should be within the previous candle high and low. Also make sure the candle is while candle . If so, go short at the open of the third candle.
3. The initial stop is placed a few pips above the previous candles high.

4. Trail stop on a closing basis with the 20-period SMA.

Instant Pip Profit


Instant Pip Profit reversal Trading with Bollinger Bands


More info for Instant Pip Profit ~ forex market hours gadget:
Read more

Sabtu, 21 Mei 2016

EUR NZD marcheaza primul target la 199 de pips - forex trading platforms usa

,

EUR NZD marcheaza primul target la 199 de pips ~ forex trading platforms usa


EUR/NZD dupa finalizarea structurii de corectie a intrat intr-o miscare ascendenta accelerata. In cursul de analiza cu elevii le recomandam sa deschida o pozitie long EUR/NZD cu un prim target la 1.6417  si un al doilea target la 1.6695. Dupa cum se poate vedea in graficul de mai sus, pretul a ajuns pe zona noastra de target vom marca aici partial profitul la +199 de pips si vom muta pozitia la BE+. Ramanem long in free trade.

Înscrieri la Cursurile de Analiz? Gann ?i abonare la Buletinul de Analiz? S?pt?mânal? Gann pe email
gannmasterforex@gmail.com  si pe Patreon.com


Daca analizele noastre va plac distribuiti link-ul prietenilor dumneavoastra pe canalele de socializare. Doriti sa aflati mai multe despre analiza Gann, puneti intrebari in rubrica noastra de comantarii. Va vom raspunde pe blog sau in privat dupa cum doriti.  

More info for EUR NZD marcheaza primul target la 199 de pips ~ forex trading platforms usa:
Read more

Minggu, 15 Mei 2016

Pink Scalping - forex market trading hours gmt

,

Pink Scalping ~ forex market trading hours gmt


Pink scalping is to trade a news release.
I usually change timeframes between 15 Minute and 1 Minute charts when I’m scalping.
If I want to trade a news release, I would have the 15 Minute and 5 Minute charts open.
Aside from the normal setup on 15 Minute charts, I also apply support and resistance lines following the fractals formed on the price. On the 15 Minute timeframe, I just place lines manually to indicate areas that have repeatedly served as areas of support and resistance. I also draw trendlines to indicate the price direction.

Indicators:
ADX (14),
EMA 14 close,
EMA 21 close,
EMA 40 close,
Trendline
Fractals or Swing High/Low
Pivot Points.

Pink scalping rules
I have two scalping methods of trading. The first method is used for scalping during
news releases and the other is for normal scalping.
News Straddle Approach
1. Set up a schedule for the day with high impact news releases for the EURUSD,
GBPUSD, AUDUSD, EURJPY, USDCAD and NZDUSD.
2. Five minutes before a high impact news release, place a pending buy and a pending
stop order, both 20 pips away from the price on the 5 Minute chart.
4. Set the stop losses 30 pips from the pending orders.
5. Wait for a trade to be entered then exit the trade manually with a profit of 5 pips or
more.
Normal Scalping Approach For Buy Trades
1. On the 15 Minute chart, check for any of the following signals:
a. The price is above the 21 period exponential moving average (dark orange or
red).
b. The 14 period moving average (magenta or purple) is above the 21 period
moving average. This indicates that the trend is an uptrend on the 15 Minute
timeframe. At times, I also use 5 and 8 period moving averages. They should be
above the 21 period moving average too.
c. The ADX is sloping up and is above the 30 level. This indicates that the uptrend
momentum is gaining strength.
d. The trendline indicator is slanting up. This also indicates that the trend is an
uptrend on the 15 Minute timeframe.
2. Go to the 1 Minute chart and check for the following signals:
a. The trendline indicator is slanting up, which indicates that the trend is an uptrend.
b. The ADX is sloping up or is above the 30 level.
3. Enter a buy trade on the 1 Minute chart when any one of the following conditions
occur:
a. The price breaks a resistance level or a previous swing high on the 1 Minute or
15 Minute timeframes.
b. The price bounced off from the lower trendline on the 1 Minute or 15 Minute
timeframes.
c. The price pulled back to the 21 EMA or a shorter period EMA on the 1 Minute or
15 Minute timeframes.
2. Set the stop loss level 30 pips below the price, or below the previous low. Move the
stop to the entry price (breakeven) at 5 pips profit.
3. Exit the trade at a profit of 5 pips or more.
Pink scalping
Pink scalping
In this example, the trendlines are going upward indicating that the main trend is an
uptrend on the 1 Minute and 15 Minute timeframes.
I noticed that the price had bounced from the lower trendline and was going up. Looking
at the ADX, it is also going up. So, once price had crossed above the moving averages,
I entered a buy trade before the candle closed.
I set my stop loss level below the swing lows. As soon as the trade reached 5 pips in
profit, I exited the trade.
This example is an ideal trade, but in case the price does not behave as expected, you
will have to take the profit that the market is willing to give you.
The news scalping strategy for a sell trade has the same guidelines with buy trades
because you enter both buy and sell pending orders every time.
Follow the guidelines below to enter trades without high impact news releases.
Normal Scalping Approach For Sell Trades
1. On the 15 Minute chart, check for any of the following signals:
a. The price is below the 21 period EMA (dark orange or red).
b. The 14 period moving average (magenta or purple) is below the 21 period
moving average. This indicates that the trend is a downtrend on the 15 Minute
timeframe. At times, I also use 5 and 8 period moving averages. They should be
below the 21 period moving average too.
c. The ADX is sloping up and is above the 30 level. This indicates that the
downtrend momentum is gaining strength.
d. The trendline indicator is slanting down. This also indicates that the trend is a
downtrend on the 15 Minute timeframe.
2. Go to the 1 Minute chart and check for the following signals:
a. The trendline indicator is slanting down, which indicates that the trend is a
downtrend.
b. The ADX is sloping up or is above the 30 level.
3. Enter a sell trade on the 1 Minute chart when any one of the following conditions
occur:
a. The price breaks a support level or a previous swing low on the 1 Minute or 15
Minute timeframes.
b. The price bounced off from the upper trendline on the 1 Minute or 15 Minute
timeframes.
c. The price pulled back to the 21 EMA or a shorter period EMA on the 1 Minute or
15 Minute timeframes.
2. Set the stop loss level 30 pips above the price, or above the previous high. Move the
stop to the entry price (breakeven) at 5 pips profit.
3. Exit the trade at a profit of 5 pips or more.
Pink Scalping
  
In this example, the trendlines on both 1 Minute and 15 Minute timeframes are going
downward indicating that the main trend is a downtrend.
After rejecting from an upper trendline, the price had crossed under the EMAs. The
EMAs are also beginning to form a downtrend.
The ADX is going up in the 1 Minute timeframe while it is already above 30 level in the
15 Minute timeframe. I entered a sell trade and set the stop loss level above the
previous swing high. As soon as the trade reached 5 pips in profit, I exited the trade.

More info for Pink Scalping ~ forex market trading hours gmt:
Read more

Minggu, 08 Mei 2016

Indicele dolarului reacționează la 180 de zile - canadian forex trading platforms

,

Indicele dolarului reacționează la 180 de zile ~ canadian forex trading platforms


Box Gann de 180 de zile si 720 de pips pe indicele dolarului
Indicele dolarului american a ajuns ieri în zona de ofert? major? exact pe zona de vibra?ie timp de 180 de zile.
În imaginea de mai sus putem s? observ?m c? indicele a reac?ionat exemplar pe vibra?iile de 45 de zile, 90 de zile, 135 ?i acum la 180 de zile, unde a realizat minimele ?i maximele majore.
Box-ul Gann este unul de 720 de pips 180 de zile de tranzac?ionare.

More info for Indicele dolarului reacționează la 180 de zile ~ canadian forex trading platforms:
Read more

Jumat, 06 Mei 2016

GBP USD marcheaza al doilea target la 260 pips - forex market hours monitor v2 .12.exe

,

GBP USD marcheaza al doilea target la 260 pips ~ forex market hours monitor v2 .12.exe


Dupa ce ieri lira sterlina versus dolarul american a marcat prima noastra tinta de pret a realizat o scurta corectie si iata ca azi a ajuns pe cea de a doua tinta de pret pe care o semnalasem in buletinul nostru de analiza saptamanala Gann. Marcam aici partial profitul la + 260 de pips. Ramanaem long in free trade.

Înscrieri la Cursurile de Analiz? Gann ?i abonare la Buletinul de Analiz? S?pt?mânal? Gann pe email
gannmasterforex@gmail.com  si pe Patreon.com

Daca analizele noastre va plac distribuiti link-ul prietenilor dumneavoastra pe canalele de socializare. Doriti sa aflati mai multe despre analiza Gann, puneti intrebari in rubrica noastra de comantarii. Va vom raspunde pe blog sau in privat dupa cum doriti.  

More info for GBP USD marcheaza al doilea target la 260 pips ~ forex market hours monitor v2 .12.exe:
Read more

Rabu, 04 Mei 2016

Indecision Candlestick Pattern Doji - forex market hours sydney

,

Indecision Candlestick Pattern Doji ~ forex market hours sydney


Doji
Doji is one the most important candlesticks formations. This pattern implies indecision in the market place as buyers and sellers are exterting equal pressure on the markets. In addittion, this pattern shows that there has been a large trading range. But the price does not closeon an upside oe downside bias. A true doji formation has an horizontal line instead of a body, with a long wiks. There are numerous varieties of dojis, with some examples found in Pictures , but they all connote indecision on the part of the market. If the market ia a range trading the doji indicates a neutral market. If the market is a ralling, a doji is a signal that may be losing steam an the price may start to decline from here. If the market is declining, a doji is a signal that the decline may be ending and the market may start to decline from here. Therefore, a doji provides signals of potential market top or bottoms. Hower it is also important to compare the doji to recent price action. If there has been a series of near doji or small candles the doji formations is less significant. A doji formation is significat it is appears after a long green candle in an uptrend or a long red candle in a dow trend. A double doji shows that buyers and sellers are still in equilibrium, wich further indicates that a trend reversal is probably imminent.

Below example of Doji formations:
A simple doji candle, which displays amuted range and a close equal to the open.


A long-legged doji candle, which shows a wide-ranging day with both bulls and bears at a standstill by the end of the period.


Doji Candlestick Pattern Quiz

1.What is the structure of a doji pattern?
  • Doji has an horizontal line instead of a body
  • Doji has an horizontal line instead of a body, with a short wiks
  • Doji has an horizontal line instead of a body, with a long wiks
2. What does the doji pattern?
  • Decision in the market place: buyers are more that sellers
  • Indecision in the market place: buyers and sellers are exterting equal pressure
  • Decision in the market place: sellers are more that buyers
3.When Doji is less significant?
  • If there has been a series of near doji and engulfing patterns
  • If there has been a series of near doji or long candles
  • If there has been a series of near doji or small candles
4. When Doji is more significant?
  • Doji appears after a long green/red candle in an trend
  • Doji appears before a long green/red candle in an trend
  • Doji appears before a harami candle in an trend
Score =

Correct answers:

More info for Indecision Candlestick Pattern Doji ~ forex market hours sydney:
Read more

Selasa, 03 Mei 2016

Superscalper with EMA - forex 4 hour trading strategy

,

Superscalper with EMA ~ forex 4 hour trading strategy


Super Scalper with EMA is a trend-momentum strategy.
Time Frame 5 min.
Currency pairs: EUR/USD, GBP/USD, AUD/USD, AUD/JPY, USD/CHF (features currency pairs is be low spreads).
Sessions trade: London and New York.

You can trade a maximum of 3 non-correlated currency pairs.
We use four main indicators in this strategy.
Slow Stochastic with a setting of 8,3,3 applied to the High, Low, and Close price. The overbought is set to level 80 and the oversold is set to level 20.
Exponential moving average, EMA 34 periods (close).
Exponential moving average, EMA 8 periods (close).
Exponential moving average, EMA 100 periods (close).
Pivot point levels (tool that have all trading platform).

To trade only in the direction of the trend as we identify
The trend is up when 8EMA>34EMA>100.
The trend is down when 8EMA<34EMA<100.

Criteria for buy signal
First condition: the trend is up: 8EMA>34EMA>100
8 EMA >34EMA;
The Stochastic crosses upward.
Buy whe the price come back and bouce on the 8 EMA.
Re-entry when stochastic indicator turn below level 20,crosses upward and the previous conditions are agree.
Superscalper with EMA
Superscalper with EMA EUR/USD 5 min chart

Criteria for sell signal
First condition: the trend is up: 8EMA<34EMA<100
8 EMA <34EMA;
The Stochastic crosses downward.
Buy whe the price come back and bouce on the 8 EMA.
Re-entry when stochastic indicator turn above level 80,crosses downward and the previous conditions are agree.

First stop loss 15-20 pips. When that occurs that Im in gain, I move my stop to breakeven.
Profit target 8-12 pips or at the pivot levels.

Money management: for 5 minute chart never going above a 1% risk per trade, with 3 losses in a row you could easily lose 3% down in one day.
Superscalper with EMA EUR/USD 5 min chart


More info for Superscalper with EMA ~ forex 4 hour trading strategy:
Read more

Rabu, 27 April 2016

Detrend Forex Trading System - trading hours in forex

,

Detrend Forex Trading System ~ trading hours in forex


Detrend Forex Trading System is a momentum strategy.
Time Frame 60 min or higher.
Currency pairs: majors (only 60 min time frame) or higher time frame.

Indicators:
Simple moving average 3 period close;
Simple moving average 15 period close;
Detrend Indicator (DPO) 14 period close;
ADX (14 period close, with 25 level);
MACD (default setting: 12, 26, 9).
See setting in the picture below:
In the above chart, the black MA is the 3 day, and the light blue MA is the 15 day. When
using the 3/15 cross, a buy confirmation is when the 3 day crosses above the 15 day, and a
sell confirmation is when the 3 day crosses below the 15 day. (Please see above chart) For
us to take a signal from the DPO, when the confirmation from the MACD and DMI
(optional) is there, the 3/15 must confirm the trade by crossing up to 3 candles before or
after the DPO crosses the zero line. Let’s say the DPO crosses above the zero line and that cross is confirmed by the MACD and the DMI, and then on the same candle the 3/15 crosses also, or on the 2 nd or 3 rd candle after the DPO crosses the 3/15 crosses, this is a valid signal. If on the other hand the 3/15 cross first, (which occurs much more frequently) and we get a signal on the DPO on that candle or the second or third candle after the cross of the 3/15, then that is a valid confirmation. In the above chart, both of these examples of the 3/15 cross is a perfect example of a valid sell signal, and then a valid buy signal,
confirmed by all indicators at the same time.

Rules Detreend forex trading System

Long Entry
1 The Detrend indicator cross above the zero line.
2The MACD line must be above the signal line.
3 The +DI should be above the –DI or just be crossing above the -DI. (As you learned, this is not 100% necessary, but preferable.)
4 the 3 MA must cross above the 15 MA up to 3 candles either
before or after the upward cross of the Detrend Indicator.

Short Entry
1 The Detrend indicator cross below the zero line.
2 The MACD line must be below the signal line.
3 The +DI should be below the –DI or just be crossing below the -DI. (As you learned, this is not 100% necessary, but preferable.)
4 Finally, the 3 MA must cross below the 15 MA up to 3 candles either
before or after the upward cross of the Detrend indicator .

Exit Position (EUR/USD 60 min)
Place your stop loss 10 pips below the 15 MA on a long trade or 15 pips above the 15 MA on a short trade, OR put the stop at 30 pips, whichever is closer. (35 – 40 on the EUR/USD)
Continually trail the stop 10 pips below the 15 MA on a long trade or 15 pips above the 15 MA on a short trade, as the currency moves in your favor.
Once you are up 50 pips, move your stop loss to your entry point. Leave the stop loss at your entry
point for the duration of the trade.
Exit the trade when the 3 MA crosses below the 15 MA if you are long, or when the 3 MA crosses above the 15 MA if you’re short.
This is an example of a buy signal on the USD/CHF that was not confirmed by the DMI. If
you look closely, at the time of this trade the +DI had not yet crossed above the –DI. It was
still below it, however the +DI and –DI were converging very close together, and the DPO
had crossed 2 candles after the 3/15 cross, and the MACD confirmed the trade, so it was
okay to take this signal. Had the two lines of the DMI still been very far apart and widely separated you would want to pass on the trade. This ended up being a very profitable trade. It is important that when exiting the trade, you wait for the 3 to fully cross the 15 MA, because as you can see by the area that is circled on the chart, they nearly crossed but didn’t quite cross in the middle of the trade, and the currency ended up moving quite a bit further before the 3/15 finally crossed, confirming the exit of the trade.
Bought – 1.2447
Stop Loss – 1.2410 (37 pips, 10 pips below the 15 MA)
Sold – 1.2656
Profit – 209 Pips
Detrend (DPO) Forex Trading System
Here is an example of two short trades on the USD/CHF, one right after the other. They
were both good trades, confirmed by all indicators simultaneously.
First Trade:
Sold – 1.4133
Stop Loss – 1.4177, 40 pips (Also 15 pips above the 15 MA)
Bought – 1.4067
Profit – 66 pips
Second Trade:
Sold – 1.4028
Stop Loss – 1.4063, 35 pips (15 pips above the 15 MA)
Bought – 1.3876
Profit – 152 pips

More info for Detrend Forex Trading System ~ trading hours in forex:
Read more

Minggu, 24 April 2016

Morning Star candlestick pattern - best forex trading times gmt

,

Morning Star candlestick pattern ~ best forex trading times gmt


Morning Star candlestick pattern there are many variations of the Morning Star pattern.
Criteria
1. Usually consists of three candles at the bottom of a downtrend.
2. First candle is a red candle.
3. Second candle is an indecision candle. There can be 1, 2, 3, or even 4 indecision candles.
4. Third candle is a blue candle and should close at least half way up the first red candle.
5. The longer the red and blue candles the more forceful the reversal.
6. The more indecision of the indecision candle the better probability that a reversal will occur.
7. The further the third blue candle closes into the first red candle the stronger the reversal.
Morning Star candlestick pattern


Here are some variations of the morning star pattern:
Morning Star candlestick pattern


More info for Morning Star candlestick pattern ~ best forex trading times gmt:
Read more

Sabtu, 23 April 2016

GBP USD loveste primul target la 203 pips - forex market hours monitor v2.12.rar

,

GBP USD loveste primul target la 203 pips ~ forex market hours monitor v2.12.rar


In buletinul de analiza saptamanala Gann, trimis abonatilor inaintea deschiderii tranzactiilor acestei saptamani, semnalam ca lira sterlina versus dolarul american se pregateste de long si recomandam deschiderea unei pozitii de cumparare cu un raport risc profit rezonabil.
Piata a confirmat scenariul nostru de tranzactionare si dupa cum putem sa vedem in graficul de mai sus, pretul a ajuns pe prima noastra zona de targetare. Daca va aduceti aminte pe 27 ianuarie afirmam ca potrit analizei noastre lira sterlina ar trebui sa targeteze zona lui 1.4450.Marcam partial profitul la +203 pips si mutam nivelul de stop loss la BE+. Ramanem long in free trade.

Înscrieri la Cursurile de Analiz? Gann ?i abonare la Buletinul de Analiz? S?pt?mânal? Gann pe email
gannmasterforex@gmail.com  si pe Patreon.com

Daca analizele noastre va plac distribuiti link-ul prietenilor dumneavoastra pe canalele de socializare. Doriti sa aflati mai multe despre analiza Gann, puneti intrebari in rubrica noastra de comantarii. Va vom raspunde pe blog sau in privat dupa cum doriti.  

More info for GBP USD loveste primul target la 203 pips ~ forex market hours monitor v2.12.rar:
Read more

Jumat, 22 April 2016

Piața de la Tokyo va fi à nchisă - forex trading platform reviews canada

,

Piața de la Tokyo va fi à nchisă ~ forex trading platform reviews canada


Luni, pia?a japonez? va fi închis? pentru c? se s?rb?tore?te ziua recuno?tin?ei. Pie?ele din Singapore ?i Hong Kong dar
?i cele din Australia ?i Noua Zeelanda vor fi deschise. Vom începe s?pt?mâna de tranzac?ionare cu o lichiditate sc?zut?.

More info for Piața de la Tokyo va fi à nchisă ~ forex trading platform reviews canada:
Read more

Senin, 18 April 2016

AUDCHF marcheaza primul target la 109 pips - forex trading platforms uk

,

AUDCHF marcheaza primul target la 109 pips ~ forex trading platforms uk


Ieri recomandam deschiderea unei pozitii short pe AUDCHF dupa strapungerea nivelului de suport dinamic al unghiului 1x1. Prima tinta vizata de noi era nivelul de suport dinamic al unghiului 8x1. Dupa cum se poate vedea in graficul nostru de 4h postat mai sus in acest moment pretul se gaseste pe suportul dinami 8x1. Intr-o analiza din cursul acestei dimineti semnalam ca vizam un al doilea target mai jos in zona lui 0.6910. Va trebui insa sa avem rabdare. Marcam aici partial profitul la +109 pips si ramanem short in free trade.


Înscrieri la Cursurile de Analiz? Gann ?i abonare la Buletinul de Analiz? S?pt?mânal? Gann pe email
gannmasterforex@gmail.com  si pe Patreon.com

Daca analizele noastre va plac distribuiti link-ul prietenilor dumneavoastra pe canalele de socializare. Doriti sa aflati mai multe despre analiza Gann, puneti intrebari in rubrica noastra de comantarii. Va vom raspunde pe blog sau in privat dupa cum doriti.  

More info for AUDCHF marcheaza primul target la 109 pips ~ forex trading platforms uk:
Read more

Minggu, 17 April 2016

Stochastic power ranger trading system - forex trading hours japan

,

Stochastic power ranger trading system ~ forex trading hours japan


Stochastic power ranger trading system is a momentum strategy.
Time Frame H1 or higher.
Currency pairs: majors at the H1 time frame.
Stochastic power ranger trading system is based on the concept that a range will form after the market finishes trending. We use the stochastic to give us an indication of a possible range formation. We also rely on the current market momentum to tell us when to go long or short. If the market is moving in an uptrend, we look to go long in the range. The entry is determined by the
oversold region (below level 20) of the stochastic.
If the market is moving in a downtrend, we look to go short in the range. The entry is determined by the overbought region (above level 80) of the stochastic. We use the most recent high and low to determine the possible resistance and support of the range.
This strategy has two profi t targets, and we take the fi rst profi t target within the range. The second profit target.

Rules Stochastic power ranger
Long Trade Setup
We use EUR/USD on the H1 time frame to illustrate a long trade. Here are the steps to execute the Stochastic power ranger strategy for long:
1. Draw an uptrend line based on a series of higher highs and higher lows. (See Figure 1 .)
2. On the stochastic, look for %K and %D to go below level 20 (oversold). (See Figure 2.)
3. Determine the support and resistance of the range. Enter long once the stochastic crosses above level 20.
4. Set the first profi t target at the 75% mark of the range. Set the stop loss at a risk to reward ratio of 1:1, and set the second profit target at risk to reward ratio of 1:2. After calculation, the stop loss must be below the support level. If not, the trade is considered invalid. (See Figur3 .)
Stochastic power ranger trading system
1

2

3

Stochastic power ranger trading system
from the long example in Figure 4 :
Entry price = 1.2919
Stop loss = 1.2877
Profit target 1 = 1.2961
Profit target 2 = 1.3003
The risk for this trade is 42 pips, and the reward is 84 pips if both targets are hit. The risk to reward ratio is 1:2, which yields a tidy 6% return if we take a 3% risk.

Short Trade Setup
We use AUD/USD on the H1 time frame to illustrate a short trade. Here are
the steps to execute the power ranger strategy for short:
1. Draw a downtrend line based on a series of lower highs and lower lows. (See Figure 5 .)
2. On the stochastic, look for %K and %D to go above level 80 (oversold). (See Figure 6 .)
3. Determine the support and resistance of the range. Enter short once the stochastic goes below level 80.
4. Set the fi rst profit target at the 75% mark of the range. Set the stop loss at a risk to reward ratio of 1:1, and set the second profi t target at risk to reward ratio of 1:2. After calculation, the stop loss must be above the resistance level. If not, the trade is considered invalid. (See Figure 7 .)
Stochastic power ranger strategy
5

6

7

Stochastic power ranger strategy
Stochastic power ranger trading system
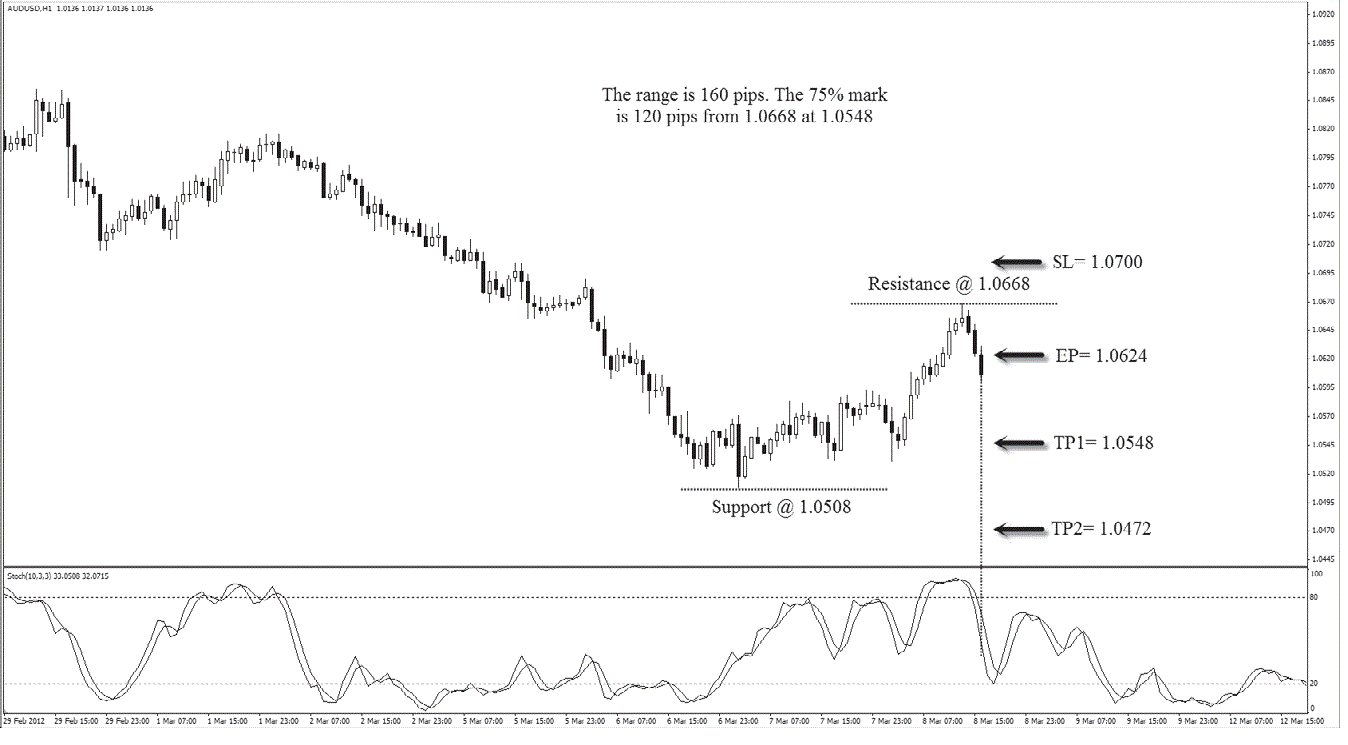
From the short example in Figure 8 :
Entry price = 1.0624
Stop loss = 1.0700
Profit target 1 = 1.0548
Profit target 2 = 1.0472
The risk for this trade is 76 pips, and the reward is 152 pips if both targets are hit. The risk to reward ratio is 1:2, which yields a tidy 6% return if we take a 3% risk.

More info for Stochastic power ranger trading system ~ forex trading hours japan:
Read more

Kamis, 14 April 2016

Eur Usd pe prima zona de targetare la 222 pips - forex market hours volatility

,

Eur Usd pe prima zona de targetare la 222 pips ~ forex market hours volatility


In imaginea de mai sus se poate vedea graficul de analiza zilnic trimis abonatilor la buletinul de analiza saptamanala Gann. Piata a respectat scenariul nostru de tranzactionare si dupa cum se poate vedea in graficul de mai jos in acest moment ne apropiem de cel de-al doilea target vizat de noi.
Am marcat profitul realizat la +222 de pips , am mutat nivelul de stop loss la BE+, ramanem long in free trade.

Inscrieri la buletinul de analiza saptamanala Gann pe email gannmasterforex@gmail.com

More info for Eur Usd pe prima zona de targetare la 222 pips ~ forex market hours volatility:
Read more

Rabu, 13 April 2016

GBPAUD loveste primul target la 268 de pips - forex trading platforms ranking

,

GBPAUD loveste primul target la 268 de pips ~ forex trading platforms ranking


Ieri postam o analiza pe GBPAUD in care spuneam:
"Lira sterlina versus dolarul australian a gasit suport pe unghiul 1x1 ]n zona suportului fix de 50% a box-ului nostru de 45 de zile. Dupa testarea suportului dinamic 1x1 pretul a intrat in raliu accelerat . Dupa cum putem vedea in graficul de 4h de mai sus, perechea a realizat o structura corectiva si consideram ca exista un grad foarte ridicat de probabilitate ca perechea sa isi continue miscarea ascendenta spre nivelul de rezistenta dinamica a unghiului 2x1 aflat in confluenta cu nivelul de rezistenta fixa de la 25% a box-ului. Am introdus o pozitie long cu un prim target la 2.0750 si un al doilea target la 2.1000 sub nivelul de rezistenta dinamica a unghiului 8x1."

Piata a confirmat analiza noastra si in acest moment pretul se gaseste pe prima zona de targetare. Marcam partial profitul la +268 de pips.Ramanem long in free trade.

Înscrieri la Cursurile de Analiz? Gann ?i abonare la Buletinul de Analiz? S?pt?mânal? Gann pe email
gannmasterforex@gmail.com  si pe Patreon.com

Daca analizele noastre va plac distribuiti link-ul prietenilor dumneavoastra pe canalele de socializare. Doriti sa aflati mai multe despre analiza Gann, puneti intrebari in rubrica noastra de comantarii. Va vom raspunde pe blog sau in privat dupa cum doriti.  

More info for GBPAUD loveste primul target la 268 de pips ~ forex trading platforms ranking:
Read more

GBP USD marcheaza cel de al treilea target la 381 pips - best forex trading times uk

,

GBP USD marcheaza cel de al treilea target la 381 pips ~ best forex trading times uk


Dupa cum stiti deja, in buletinul de analiza saptamanala Gann, am recomandam clientilor nostri sa cumpere lira sterlina versus dolarul american. Piata a confirmat asteptarile noastre si in acest moment pretul a marcat cel de-al treilea target al nostru de la 1.46 (pe care l-am postat dimineata pe tweeter). Marcam partial profitul la +381 pips. Ramanem long in free trade.

Inscrieri la buletinul de analiza Gann pe email gannmasterforex@gmail.com

More info for GBP USD marcheaza cel de al treilea target la 381 pips ~ best forex trading times uk:
Read more

Rabu, 30 Maret 2016

AUDCHF marcheaza cel de al doilea target la 250 pips - forex trading hours new year

,

AUDCHF marcheaza cel de al doilea target la 250 pips ~ forex trading hours new year


Saptamana trecuta am initiat o pozitie short pe perechea AUDCHF . In ultima noastra analiza pe aceasta perechea spuneam:
"Ieri recomandam deschiderea unei pozitii short pe AUDCHF dupa strapungerea nivelului de suport dinamic al unghiului 1x1. Prima tinta vizata de noi era nivelul de suport dinamic al unghiului 8x1. Dupa cum se poate vedea in graficul nostru de 4h postat mai sus in acest moment pretul se gaseste pe suportul dinami 8x1. Intr-o analiza din cursul acestei dimineti semnalam ca vizam un al doilea target mai jos in zona lui 0.6910. Va trebui insa sa avem rabdare. Marcam aici partial profitul la +109 pips si ramanem short in free trade".
In graficul nostru de mai jos, actualizat in cursul acestei dimineti puteti sa vedeti ca pretul a traversat cel dea-l doilea nivel de targetare mentionat de noi la 0.6910. Am decis sa marcam partial profitul la +250 pips dupa formarea unui shooting star care ne semnaleaza intrarea pretului intr-o noua miscare de corectie. Pozitia este mutata la BE+ suntem in continuare short in free trade. Dupa finalizarea acestei corectii vom reincarca aceasta pozitie short cu un nou target in zona lui 0.66.
Consideram ca orice raliu este o buna oportunitate de shortare a acestei perechi.


Înscrieri la Cursurile de Analiz? Gann ?i abonare la Buletinul de Analiz? S?pt?mânal? Gann pe email
gannmasterforex@gmail.com  si pe Patreon.com

Daca analizele noastre va plac distribuiti link-ul prietenilor dumneavoastra pe canalele de socializare. Doriti sa aflati mai multe despre analiza Gann, puneti intrebari in rubrica noastra de comantarii. Va vom raspunde pe blog sau in privat dupa cum doriti.  

More info for AUDCHF marcheaza cel de al doilea target la 250 pips ~ forex trading hours new year:
Read more

Minggu, 27 Maret 2016

Indicele dolarului se respinge din rezistenta 3x1 la 75 timp - forex trading platforms comparison

,

Indicele dolarului se respinge din rezistenta 3x1 la 75 timp ~ forex trading platforms comparison


In ultima noastra analiza pe indicele dolarului spuneam ca pretul testeaza nivelul de rezistenta dinamic al unghiului 3x1 si daca acesta va ceda deschide cale libera catre nivelul de rezistenta dinamica al unghiului 8x1. Dupa cum putem sa vedem in graficul postat mai sus pretul a realizat un top exact pe nivelul de rezistenta dinamica al unghiului 3x1 in momentul in care s-a suprapus cu nivelul de rezistenta timp de la 75% a box-ului nostru Gann. Dupa cum stim, Gann spunea ca in momentul in care timpul se suprapune cu pretul exista un grad foarte ridicat de probabilitate ca trendul sa-si modifice directia. Putem sa vedem ca pretul nu a reusit sa strapunga rezistenta dinamica si pe acea zona a realizat un double top dupa care azi s-a prabusit in mod accelerat. In mod evident prima tinta de pret pentru indicele dolarului este pe zona de rezistenta a canalului de pret aflat in confluenta cu nivelul de 50% a box-ului Gann. Daca acest nivel de suport va ceda urmatoarea tinta pentru pret este pe nivelul de suport fix de 0.666 . Ultimul target din perspectiva noastra ar trebui sa fie in zona de suport de la 98.50. Ce va trebui sa urmarim in aceasta tranzactie short? In primul rand sa vedem daca pretul va strapunge canalul de consolidare. Daca pretul va strapunge suportul canalului de consolidare si va gasi suport la 0.666 foarte probabil va realiza o corectie sub suportul canlului de consolidare dupa care va continua miscarea descendenta. Dar pana atunci va trebui sa managerizam corect pozitia short si sa vizam primul obiectiv de pret unde vom marca partial profitul si vom duce pozitia la BE+.


Înscrieri la Cursurile de Analiz? Gann ?i abonare la Buletinul de Analiz? S?pt?mânal? Gann pe email
gannmasterforex@gmail.com  si pe Patreon.com

Daca analizele noastre va plac distribuiti link-ul prietenilor dumneavoastra pe canalele de socializare. Doriti sa aflati mai multe despre analiza Gann, puneti intrebari in rubrica noastra de comantarii. Va vom raspunde pe blog sau in privat dupa cum doriti.  


More info for Indicele dolarului se respinge din rezistenta 3x1 la 75 timp ~ forex trading platforms comparison:
Read more

MACD 5 bars histogram - forex market hours new years eve

,

MACD 5 bars histogram ~ forex market hours new years eve


The MACD 5 bars histogram is an excellent swing trading strategy for beginners. The beauty of this strategy is that it does not require you to monitor the market for a long time. It also signals you well in advance as to when the entry of a trade is about to take place.
When prices rise, the histogram bar becomes longer as the speed of theprice movement accelerates; the bar contracts as price movement decelerates. The same principle applies when prices are falling, but the histogram bars form at the bottom.
Time Frame: H1 and H4;
Currency pairs:majors.
The MACD histogram indicates the direction and momentum of the market. When the MACD histogram switches from negative to positive, this indicates a possible upward shift in momentum. We wait for fi ve positive bars on the histogram to confirm the momentum before entering a long
trade on the fi fth bar. No prizes for guessing why the name of this strategy is called the fi fth element!
When the MACD histogram switches from positive to negative, this indicates a possible downward shift in momentum. We wait for fi ve negative bars of the histogram to confi rm the momentum before entering a short trade on the fifth bar.
Buy
Wait for the MACD histogram to go from negative (<0) to positive (>0).
Wait for four positive bars to form on the histogram before going long
on the opening candle of the fifth histogram.
Set the stop loss at the last low histogram.
The trade will have two profit targets with risk to reward ratios of 1:1
and 1:2 respectively.
Sell
Wait for the MACD histogram to go from positive (<0) to negative (>0).
Wait for four negative bars of the histogram before going short on the
opening candle of the fi fth histogram.
Set the stop loss at the previous high swing.
The trade will have two profit targets with risk to reward ratios of 1:1

and 1:2 respectively.
MACD 5 bars histogram
MACD 5 bars histogram buy example

MACD 5 bars histogram
MACD 5 bars histogram sell example


More info for MACD 5 bars histogram ~ forex market hours new years eve:
Read more

Sabtu, 26 Maret 2016

50 EMA with trend line breakout - forex trading times in gmt

,

50 EMA with trend line breakout ~ forex trading times in gmt


50 Ema with trend line breakout is a trend following system with price action analysis.
This system is super-simple and can be used on ANY timeframe.
Markets: Forex and Indicies.
The system uses a 50sma for trend direction – then we just watch, visually, for a mini-trendline to form – we then enter when the trendline ‘breaks’.
Top Tip: Trading this system on 5-minute charts during the London session can result in some big winners.

Trading rules 50 EMA with trend line breakout

Buy
When price is above 50SMA and price breaks up mini trend line.
Sell
When price is below 50SMA and price breaks down mini trend line.

Exit Position
Profit Target Ratio Stop loss 1:1 .
Place initial Stop Loss on the previous swing High/Low.
50 EMA with trend line breakout


50 EMA with trend line breakout


More info for 50 EMA with trend line breakout ~ forex trading times in gmt:
Read more
 

Forex Trading Strategy Copyright © 2016 -- Powered by Blogger